The S&P 500 Is Holding Up – But Pressure Is Building Beneath the Surface
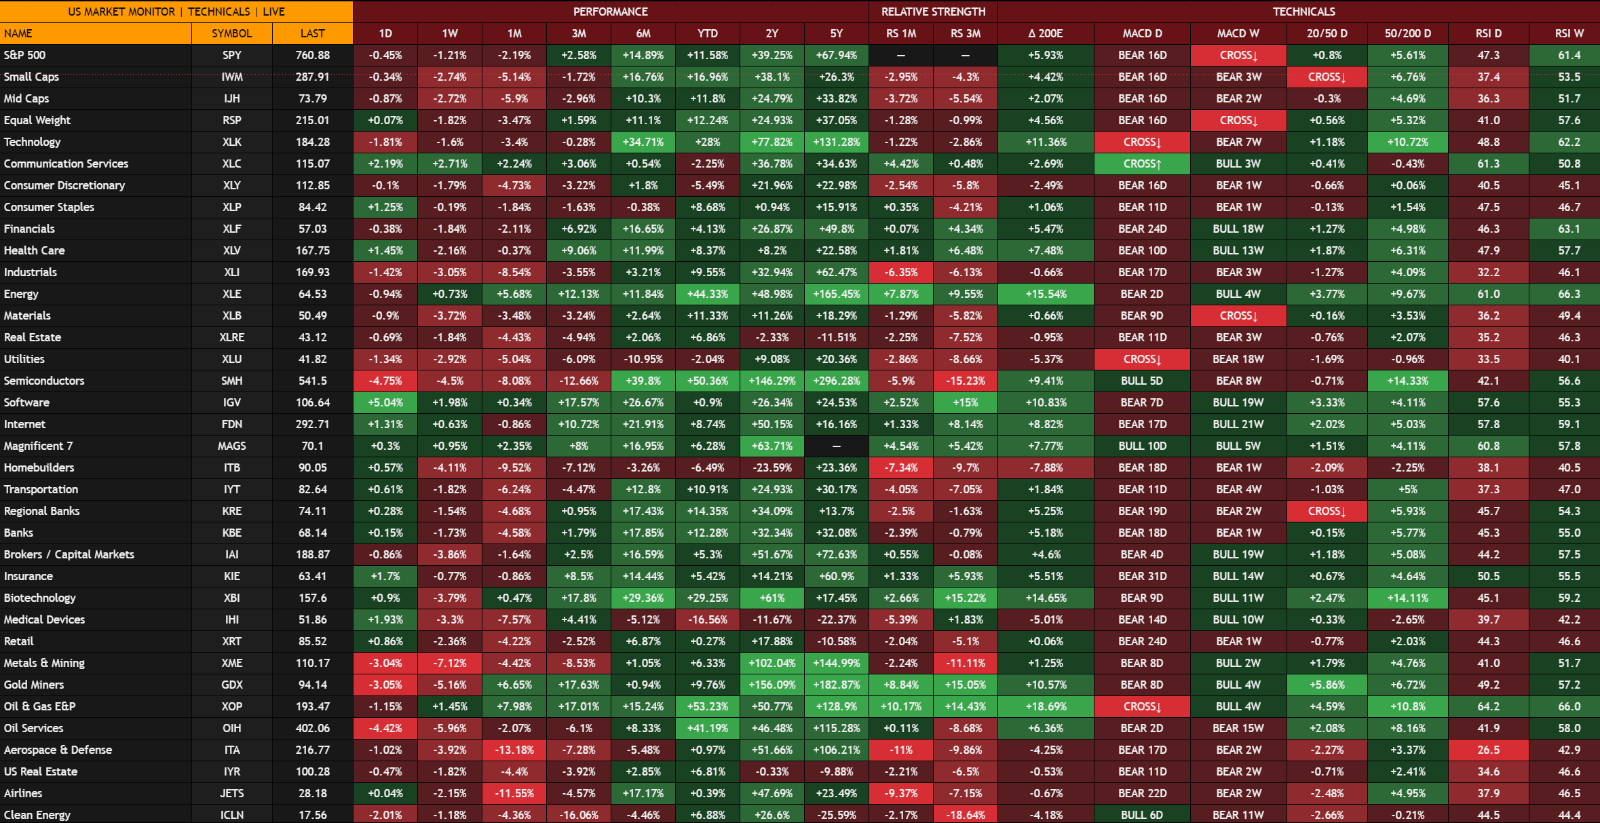
The S&P 500 still looks relatively resilient at first glance. Over the past month, the index is down around 2.2%, while still trading almost 6% above its 200-day moving average. The longer-term trend therefore remains intact. Beneath the surface, however, the picture has weakened considerably.
Market participation highlights the divergence. While the S&P 500 has lost 2.2% over one month, small caps are down 5.1%, mid caps 5.9%, and the equal-weight S&P 500 3.5%. Daily RSI readings for small and mid caps have also fallen into the 36–37 range. Large-cap indices are holding up better than the average stock, while short-term momentum continues to deteriorate.
The S&P 500 itself has not yet suffered a structural technical breakdown. However, the daily MACD has remained bearish for 16 days. For us, the current setup is therefore relatively clear: the broader trend remains intact, but the market structure underneath is becoming increasingly fragile.
Don't want to miss more data-driven market insights like this? Check out our Weekly Market Recap:
https://finq-research.kit.com/cc5c1deec7
Market Leadership Is Shifting
The change becomes even more visible at the sector and industry level. Over the past three months, Software is up 17.6%, Biotechnology 17.8%, Gold Miners 17.6%, and Oil & Gas E&P 17.0%. At the same time, Semiconductors are down 12.7%, Homebuilders 7.1%, and Utilities 6.1%.
This looks less like a classic broad risk-off move and more like a pronounced sector rotation. Capital is not simply leaving equities altogether. Instead, it is moving between industries with very different macroeconomic and interest-rate sensitivities.
Semiconductors are particularly notable. SMH remains one of the strongest areas of the market over the long term, but has fallen 12.7% over three months and underperformed the S&P 500 by more than 15 percentage points over the same period. At the same time, the ETF remains around 9% above its 200-day moving average. The longer-term structure is still intact, but previous leadership has clearly weakened.
On the other side of the market, Energy is increasingly taking the lead. XLE is up around 12% over three months, while XOP has gained roughly 17%. Both have significantly outperformed the S&P 500.
The rotation within Technology is also notable. While Semiconductors have corrected sharply, Software has gained around 17.6% over three months. This is not simply a rotation out of Technology or Growth. Capital is shifting within sectors and investment themes themselves.
The Bond Market Is Changing the Setup
One of the most important explanations for the current rotation can be found outside the equity market. The US 10-year Treasury yield has moved above 5%, increasing the pressure on interest-rate-sensitive parts of the market.
Higher risk-free yields matter for equities in several ways. They raise the discount rate applied to future cash flows, increase financing costs and make government bonds more competitive relative to stocks. This is particularly relevant for sectors whose valuations or business models are highly sensitive to interest rates.
Utilities illustrate this well. The sector is down around 6% over three months and trades more than 5% below its 200-day moving average. Real Estate is showing similar relative weakness. Traditional defensive exposure is therefore not automatically providing protection in the current environment.
At the same time, inflation and energy prices remain important variables. Higher energy costs can support Energy equities while simultaneously creating inflationary pressure for the broader economy. This creates an unusual dynamic in which Energy can be a relative equity-market winner while higher energy prices remain a potential headwind for the overall index.
Fed Expectations Remain an Important Driver
Interest-rate expectations are therefore becoming increasingly important for the next stage of the rotation. If inflation remains persistent and Treasury yields stay elevated, the market has to price a more restrictive monetary-policy path.
That environment would continue to challenge highly rate-sensitive sectors and could increase the importance of cash flows, balance-sheet quality and valuation. At the same time, a stabilization in yields could quickly change the relative setup for some of the sectors that have recently been under the most pressure.
This is why we are not only watching the direction of the S&P 500, but also the interaction between Treasury yields, Fed expectations and relative sector performance.
What We Are Watching Next
Our US Market Monitor does not yet show a structurally broken equity market. It does, however, show a market whose internal structure has become considerably more challenging. Small and mid caps are losing relative strength, former leaders such as Semiconductors are correcting, and performance dispersion across industries is increasing.
At the same time, several of the recent laggards are approaching oversold levels. Industrials have a daily RSI of 32.2, Utilities 33.5, while Aerospace & Defense has fallen to just 26.5. This means the next opportunity may not only come from following current momentum leaders, but also from identifying where relative weakness begins to stabilize.
For us, the key question over the coming weeks is therefore not simply whether the S&P 500 trades a few percent higher or lower. What matters more is where capital is moving beneath the surface.
As long as Treasury yields remain elevated and dispersion between market segments continues to widen, sector and industry selection may become increasingly important relative to the direction of the index itself.
That is exactly what we want to identify early with our US Market Monitor.
Disclaimer
This article is for informational and educational purposes only and does not constitute investment advice, a recommendation to buy or sell securities, or a solicitation to trade financial instruments. All views and market assessments reflect the information available at the time of publication. Past performance is not a reliable indicator of future results.