Wall Street Is Going All In on Tech – Is It Getting Dangerous? | BofA Survey October 2026
FINQ Research | Market Intelligence | October 2026
Tech stocks remain in demand. Cash levels stand at just 3.9%. Meanwhile, fund managers are becoming more cautious about the economy and corporate earnings. How does this fit together – and what does it mean for the stock market outlook in October 2026?
The BofA Global Fund Manager Survey provides a revealing picture of institutional investors: technology is heavily overweight, semiconductors are viewed as a particularly crowded trade, and bonds are gaining ground in monthly positioning changes.
For the debate around AI stocks, the S&P 500, recession risks and rising interest rates, one question therefore matters most: how resilient is positioning when confidence starts to fade?
FINQ Research examines 19 charts and explains what they reveal about market sentiment, asset allocation and potential sector rotation.
Key Takeaways at a Glance
- Tech stocks dominate: Technology reaches a net overweight of 37%.
- Limited portfolio cash: Average cash allocations remain at 3.9%.
- Economic expectations cool: The net balance expecting a stronger global economy turns negative.
- Quality and large caps lead: High-quality earnings and larger companies remain clear favorites.
- Bonds come into focus: Positioning improves but remains underweight overall.
- Interest rates are the biggest cited tail risk: 31% identify a disorderly rise in bond yields.
The FINQ Takeaway: Investors remain invested. Their conviction is becoming more selective, however, and the gap between popular tech stocks and overlooked sectors remains wide.
Market Sentiment and Cash Levels: How Optimistic Are Fund Managers?
Investor Sentiment: Less Euphoria, No Capitulation Yet
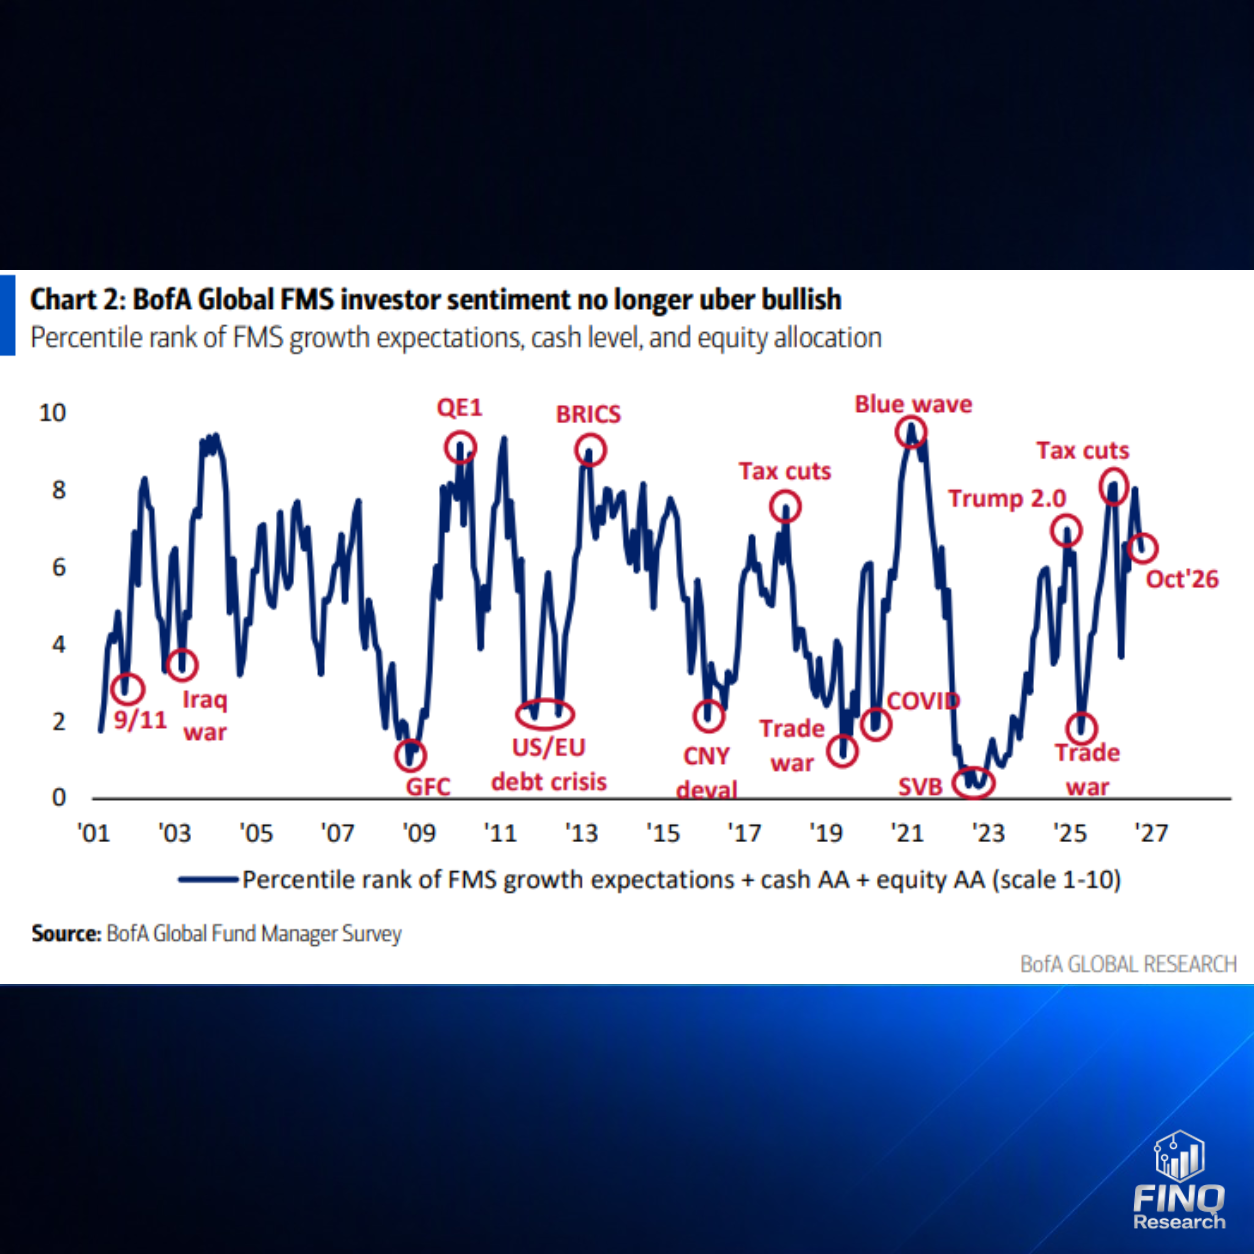
The composite sentiment indicator stands at approximately 6.5 in October on the chart's scale of 1 to 10. It has retreated from its recent highs but remains well above the lows seen during earlier periods of market stress. The indicator combines the historical ranking of growth expectations, cash holdings and equity allocations.
Confidence is cooling. The chart does not suggest broad capitulation. The key question for the analysis that follows is whether this more cautious sentiment has already translated into more defensive positioning.
3.9% Cash: Liquidity Buffers Remain Low
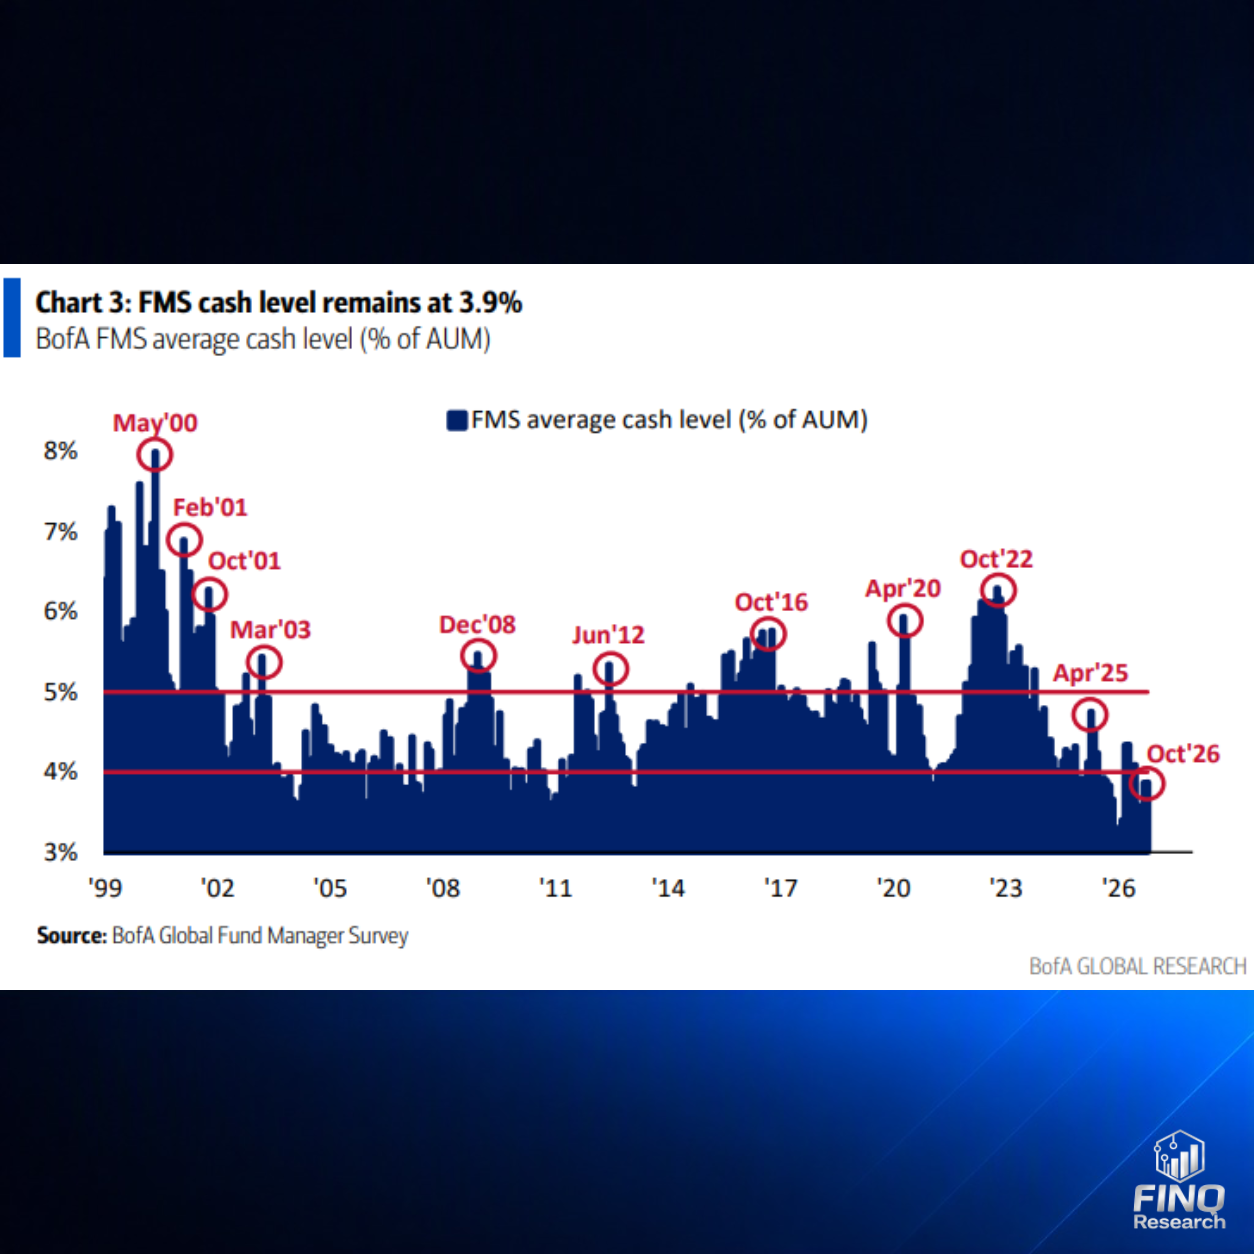
Average cash allocations remain unchanged at 3.9% of assets under management. This is low by historical standards. The surveyed funds continue to hold a large share of their capital outside cash.
A low cash allocation means these portfolios have only a limited reserve of immediately available liquidity. It does not tell us about every potential buyer in the market.
New inflows or reallocations from other asset classes remain possible. As a standalone indicator, cash levels therefore cannot reliably time a market correction.
Risk Management: Caution Despite High Investment Levels
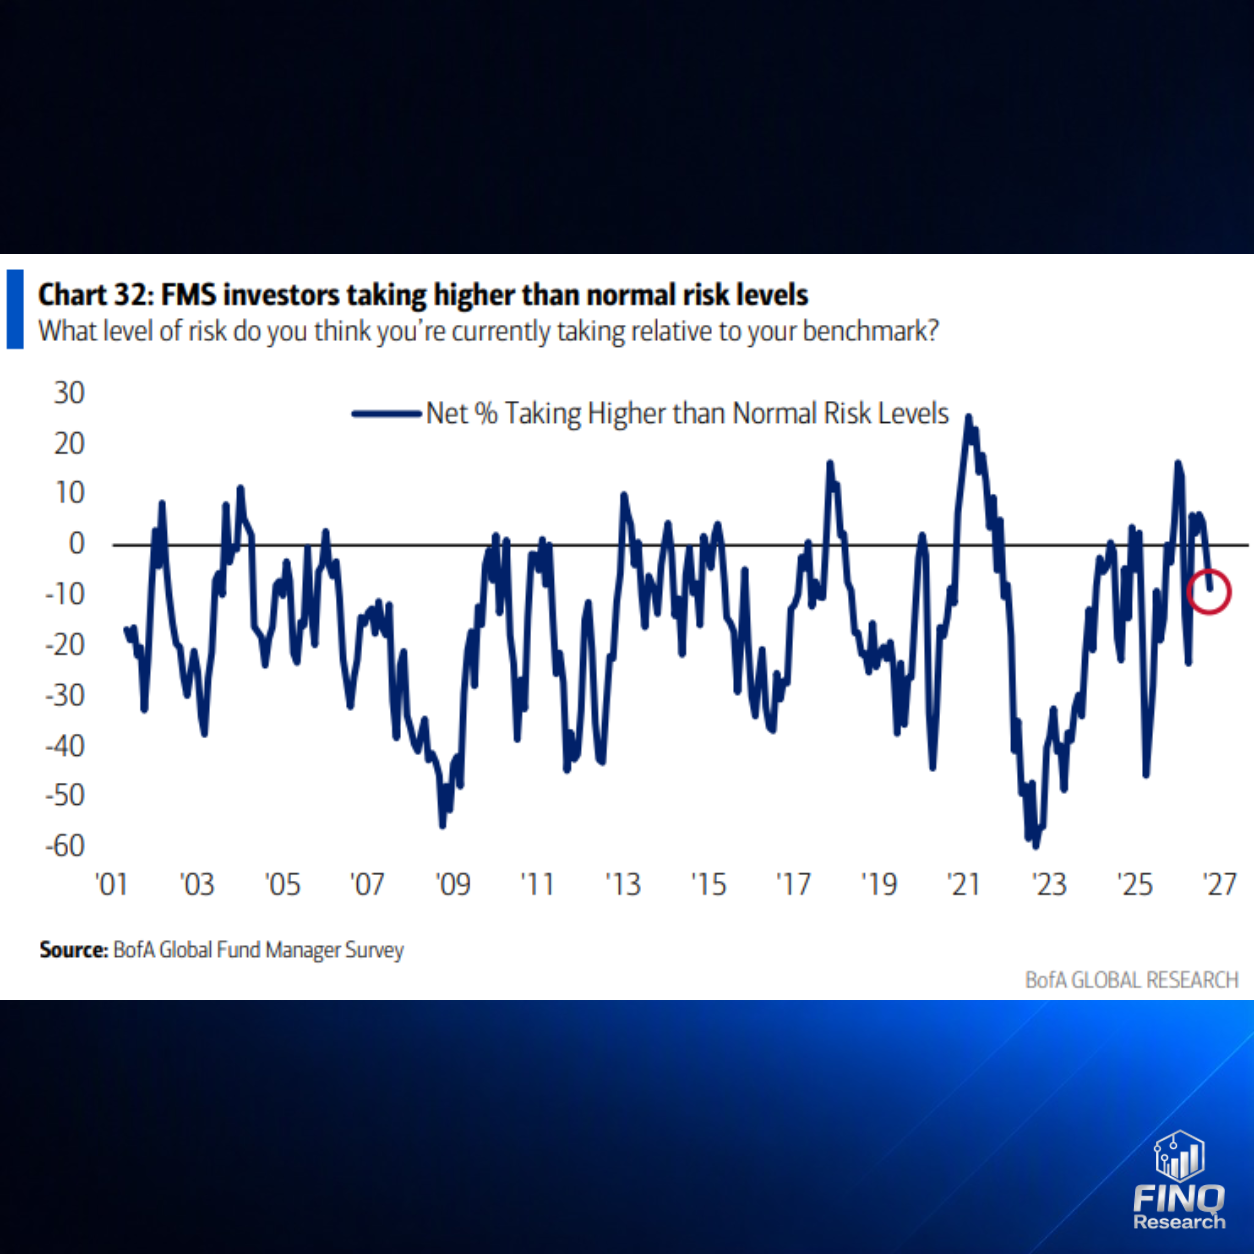
At the same time, the net balance of investors taking higher-than-normal risk falls to approximately minus 10%. Their self-assessment is therefore more cautious than the low cash allocation might initially suggest.
These findings can coexist: portfolio risk can also be adjusted through company selection, sector allocation or hedging. Moreover, the chart measures risk relative to each investor's benchmark. It measures neither a uniform equity allocation nor the absolute risk of losses across all surveyed portfolios.
FINQ Research Insight: Investors remain invested but are choosing their positions more carefully. This combination runs through the entire chart set.
The S&P 500 and the Economy: Soft Landing or Rising Recession Risk?
S&P 500: Positive Annual Returns Meet Weaker Expectations
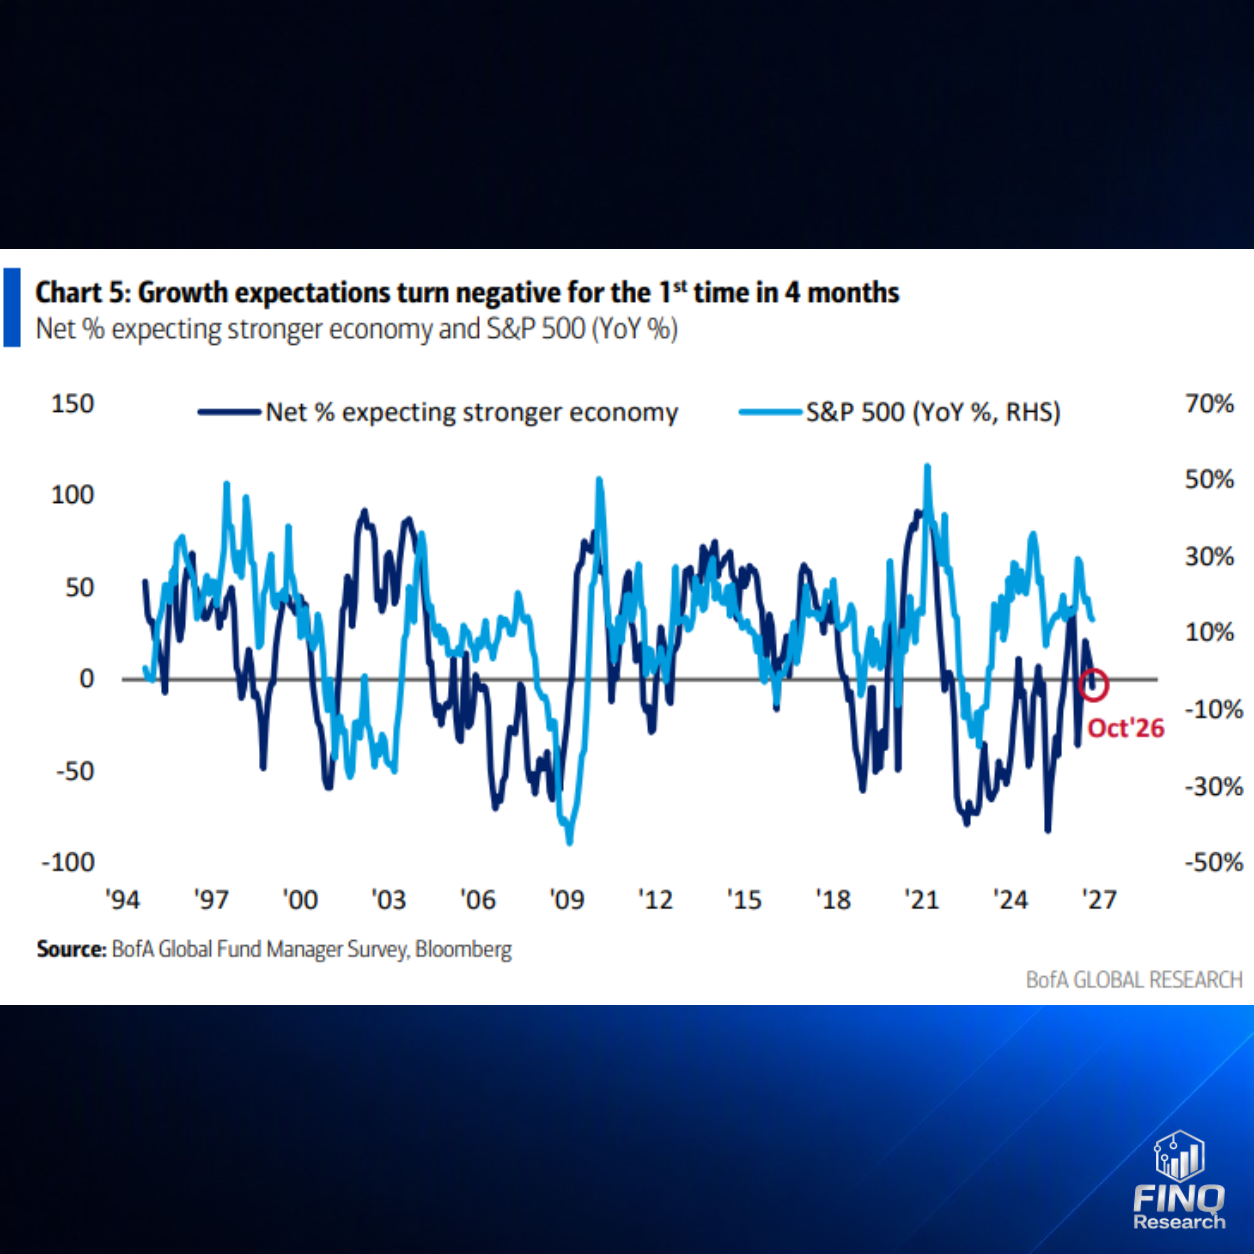
The net balance of fund managers expecting a stronger global economy falls below zero for the first time in four months. Meanwhile, the S&P 500's year-over-year change shown in the chart remains positive.
This creates a visible divergence: perceptions of the economy's direction are deteriorating while equity performance over twelve months still shows strength. A decline in stock prices does not inevitably follow. The chart compares an expectations survey with a backward-looking return; the two series can diverge for a time.
No Landing Remains the Most Widely Expected Scenario
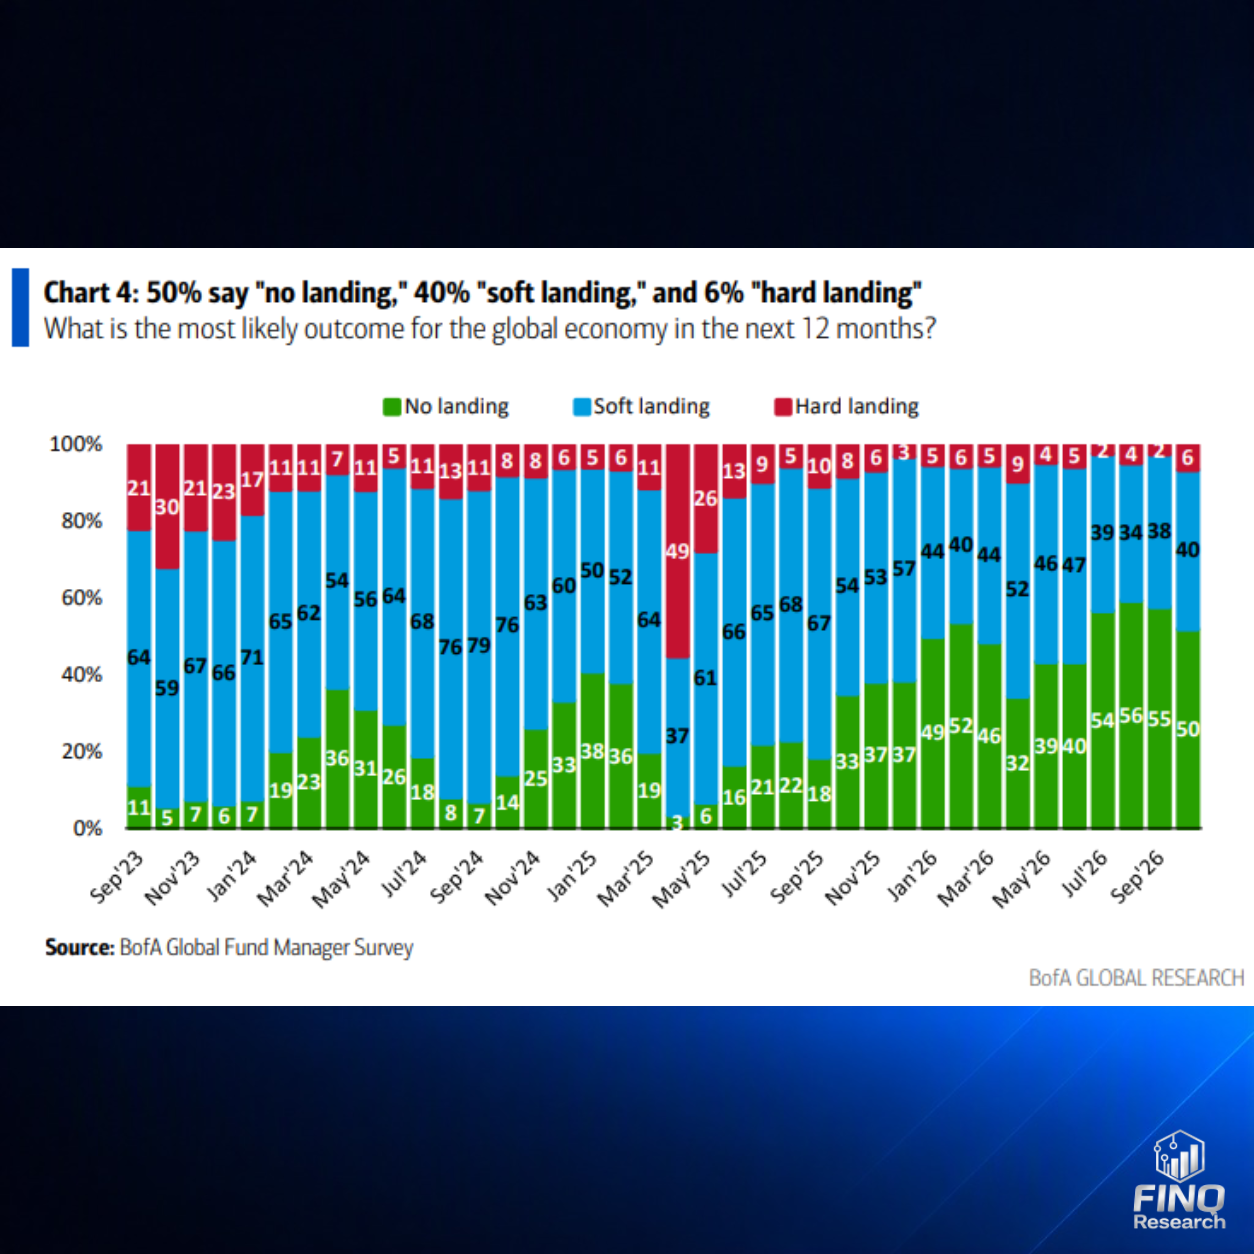
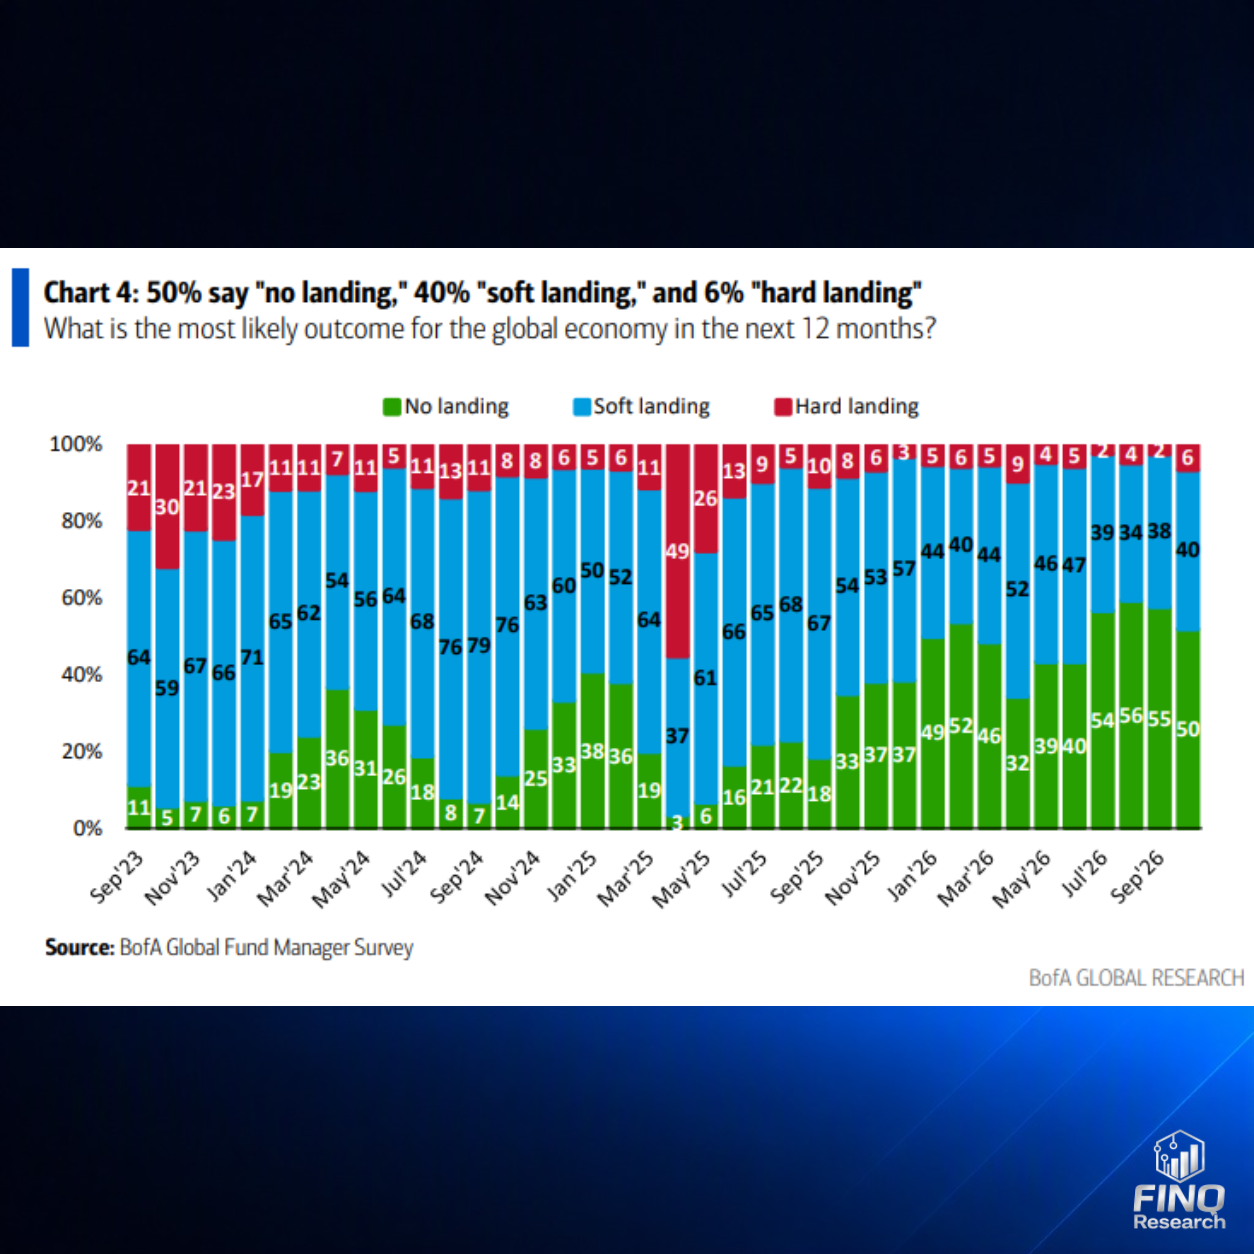
Asked about the most likely economic scenario, 50% expect no landing, 40% a soft landing and 6% a hard landing. The reported shares add up to 96%; the chart does not explain the remaining share.
Expectations are therefore clearly concentrated on scenarios that avoid a hard economic landing. Compared with the previous bar, however, the no-landing share falls from 55% to 50%, while hard landing rises from 2% to 6%. The underlying view remains resilient, but the distribution becomes somewhat more cautious.
This is consistent with negative growth expectations: an economy can lose momentum without entering a severe recession.
Boom Expectations: Above-Trend Growth and Inflation
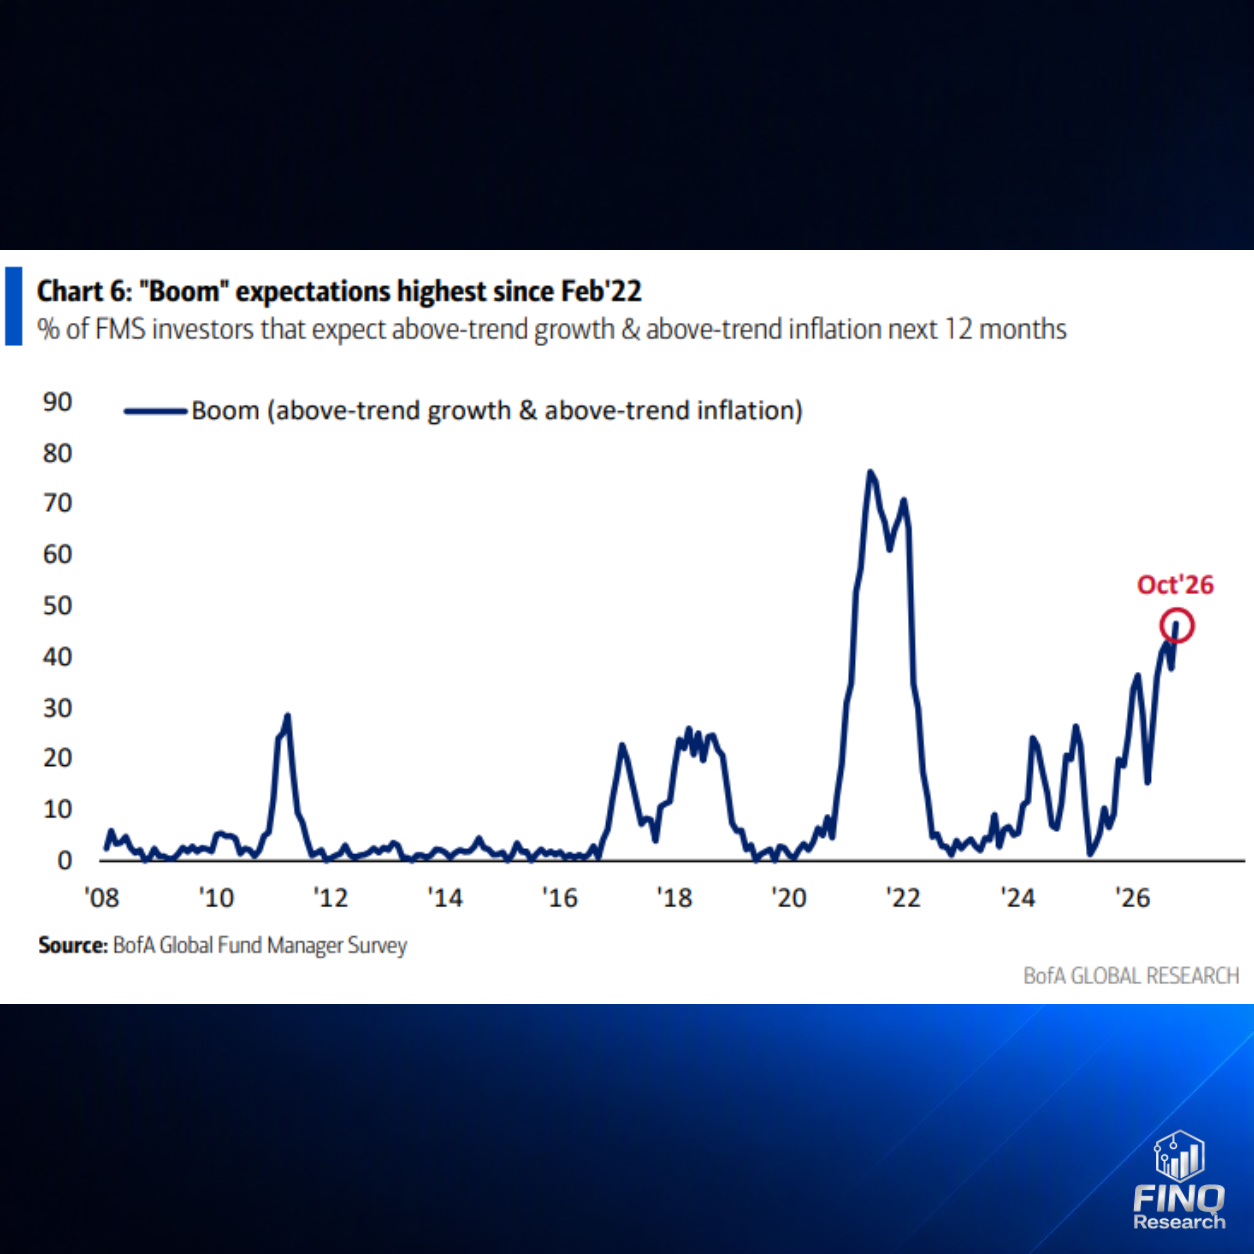
At the same time, approximately 46% expect a combination of growth and inflation above their respective trends over the next twelve months. According to the chart, this is the highest share since February 2022.
The different questions partly explain the apparent contradiction. “Stronger than before” describes a change, while “above trend” describes a level. Even after slowing, growth can remain above its long-term trend. In addition, the aggregate responses do not reveal which individuals support the same scenarios across questions.
FINQ Research Insight: The economic picture remains resilient but is becoming less clear-cut. The charts support neither a unified recession consensus nor an unreservedly optimistic overall outlook.
Inflation, Corporate Earnings and Dividends: What Is Driving the Stock Market?
Inflation Outlook: Fewer Investors Expect Inflation to Rise
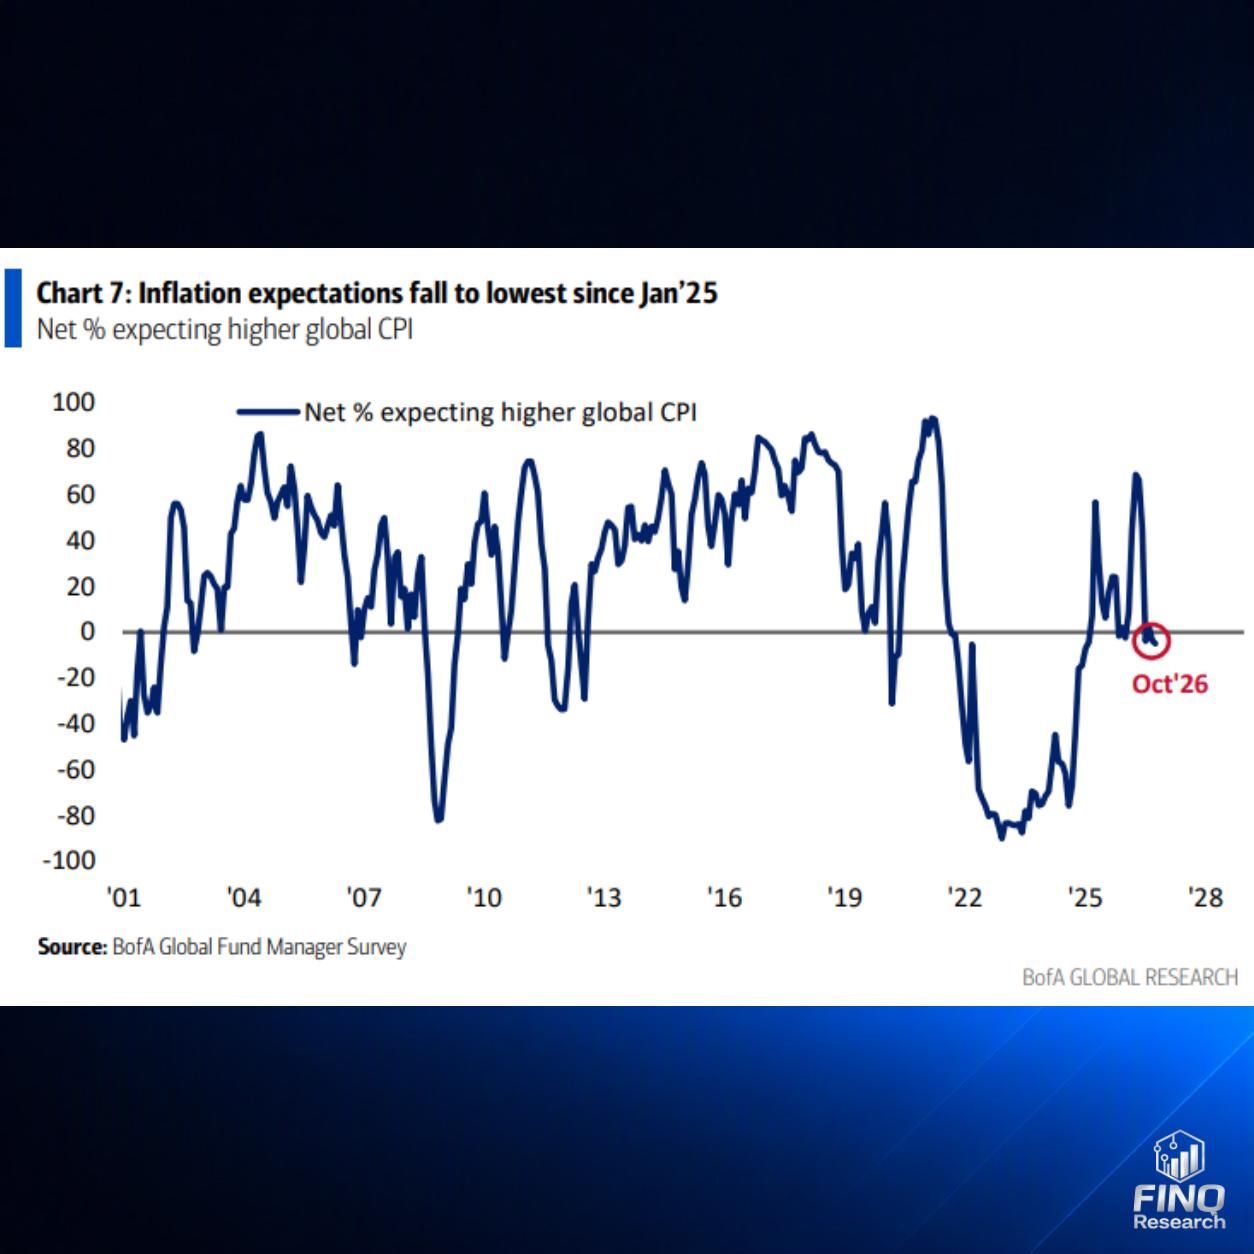
The net balance of respondents expecting higher global consumer price inflation is slightly below zero and, according to the chart, at its lowest level since January 2025.
This means expectations of a rising inflation rate are losing support. It means neither falling consumer prices nor that price stability has already been achieved.
Here, too, direction and level differ: a declining inflation rate can remain above its long-term trend. The result is therefore broadly compatible with elevated boom expectations.
Earnings Growth: Confidence Loses Momentum
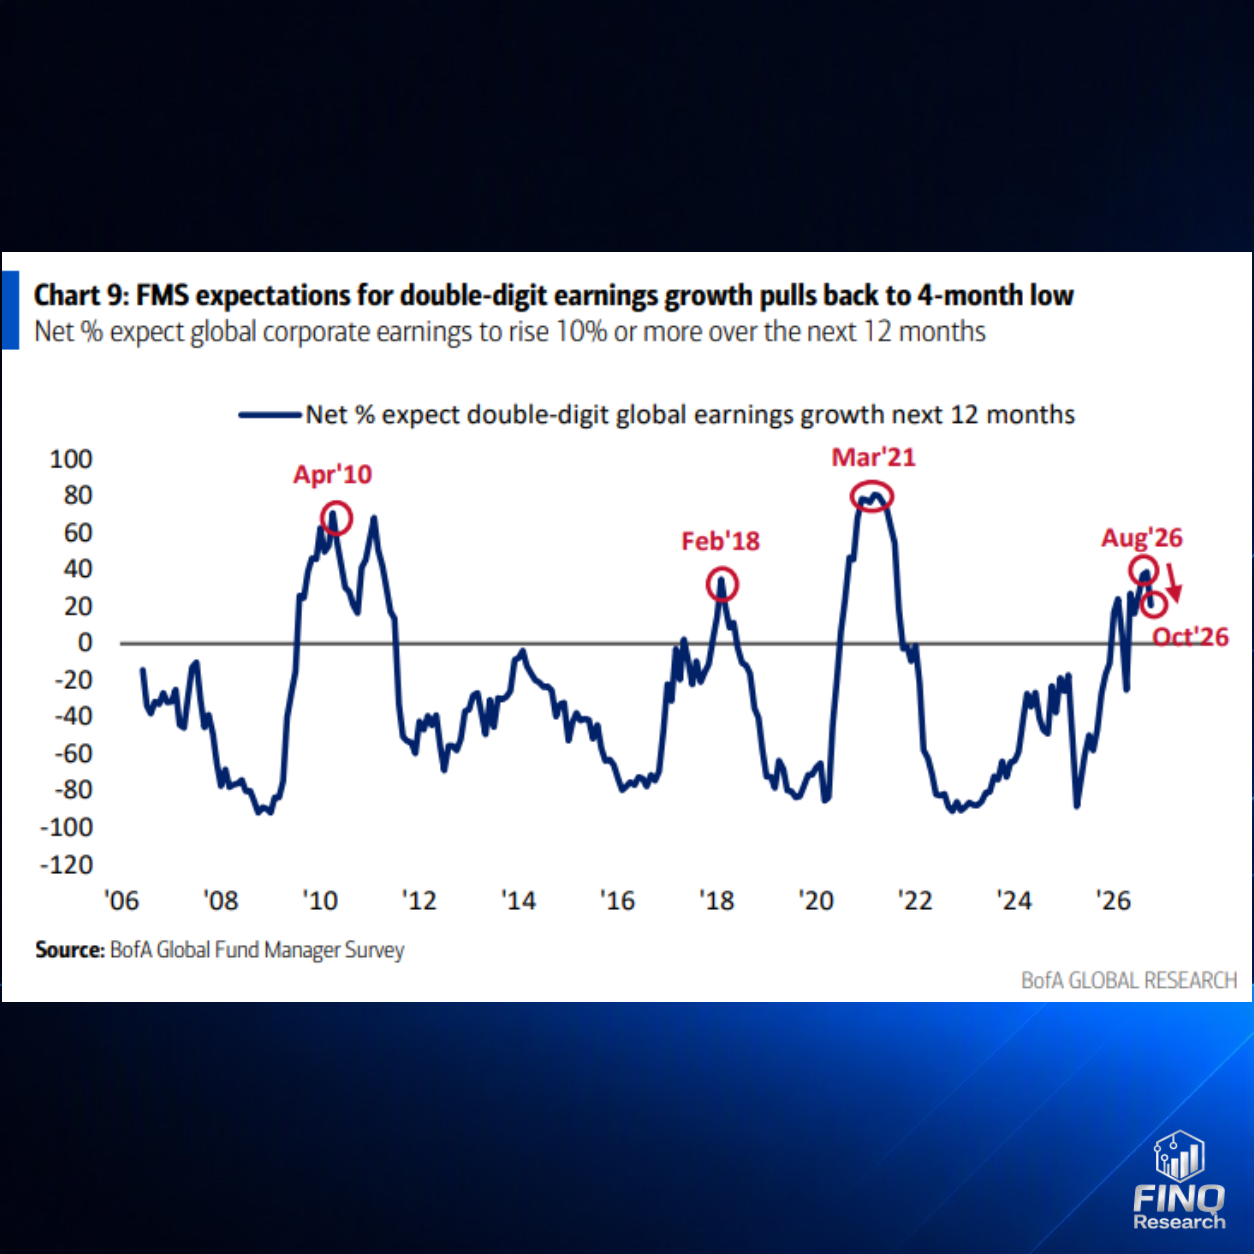
Confidence in corporate earnings is also declining. The net balance of fund managers expecting global earnings growth of at least 10% over the next twelve months falls to a four-month low. It remains positive but is visibly below the peak marked in August.
The chart therefore shows weakening conviction in strong earnings growth. It does not provide a direct forecast of the actual increase in profits. For assessing market sentiment, however, it matters that both economic and earnings expectations are becoming more cautious while equities remain favored.
Dividend Stocks: Demand for Payouts Increases
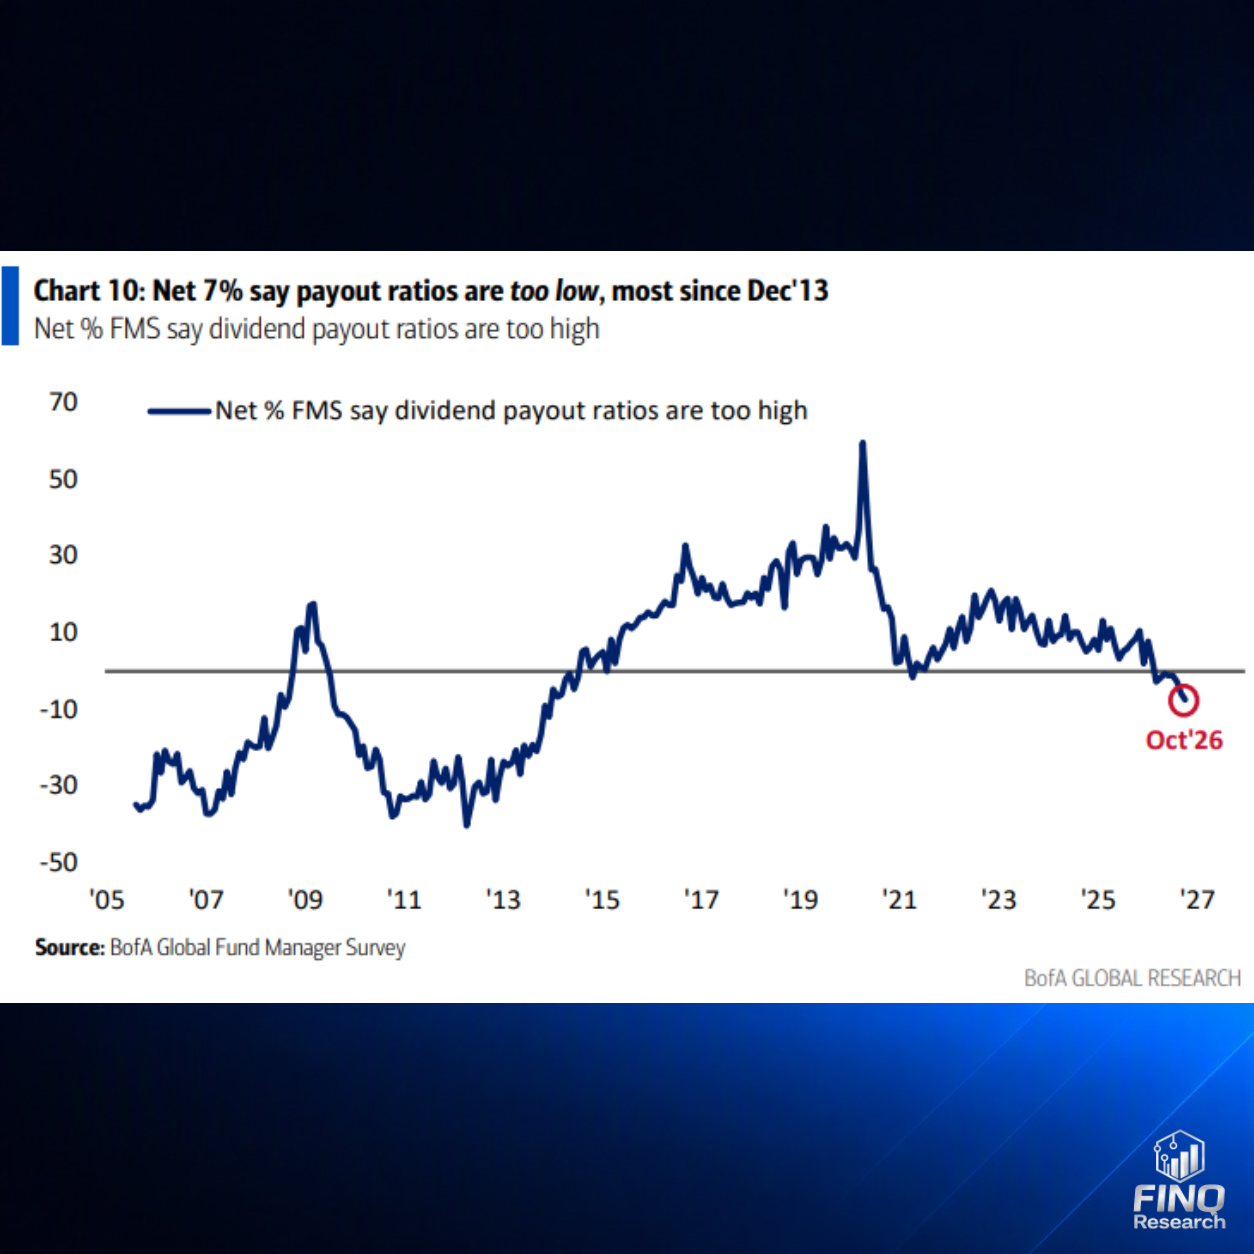
A net 7% consider payout ratios too low – the strongest such reading since December 2013. Because the plotted series asks whether payouts are “too high,” this preference appears as a negative value.
This points to stronger demand for regular shareholder distributions. It is not, however, a call for unlimited dividends: whether payouts make economic sense depends, among other things, on a company's financing needs and investment opportunities.
FINQ Research Insight: Current income is attracting more attention relative to promises of future growth alone. The preference for quality and larger companies helps illustrate the extent of this shift.
Quality Investing and Large Caps: Which Stocks Do Professionals Favor?
Comparing Quality, Momentum and Dividends
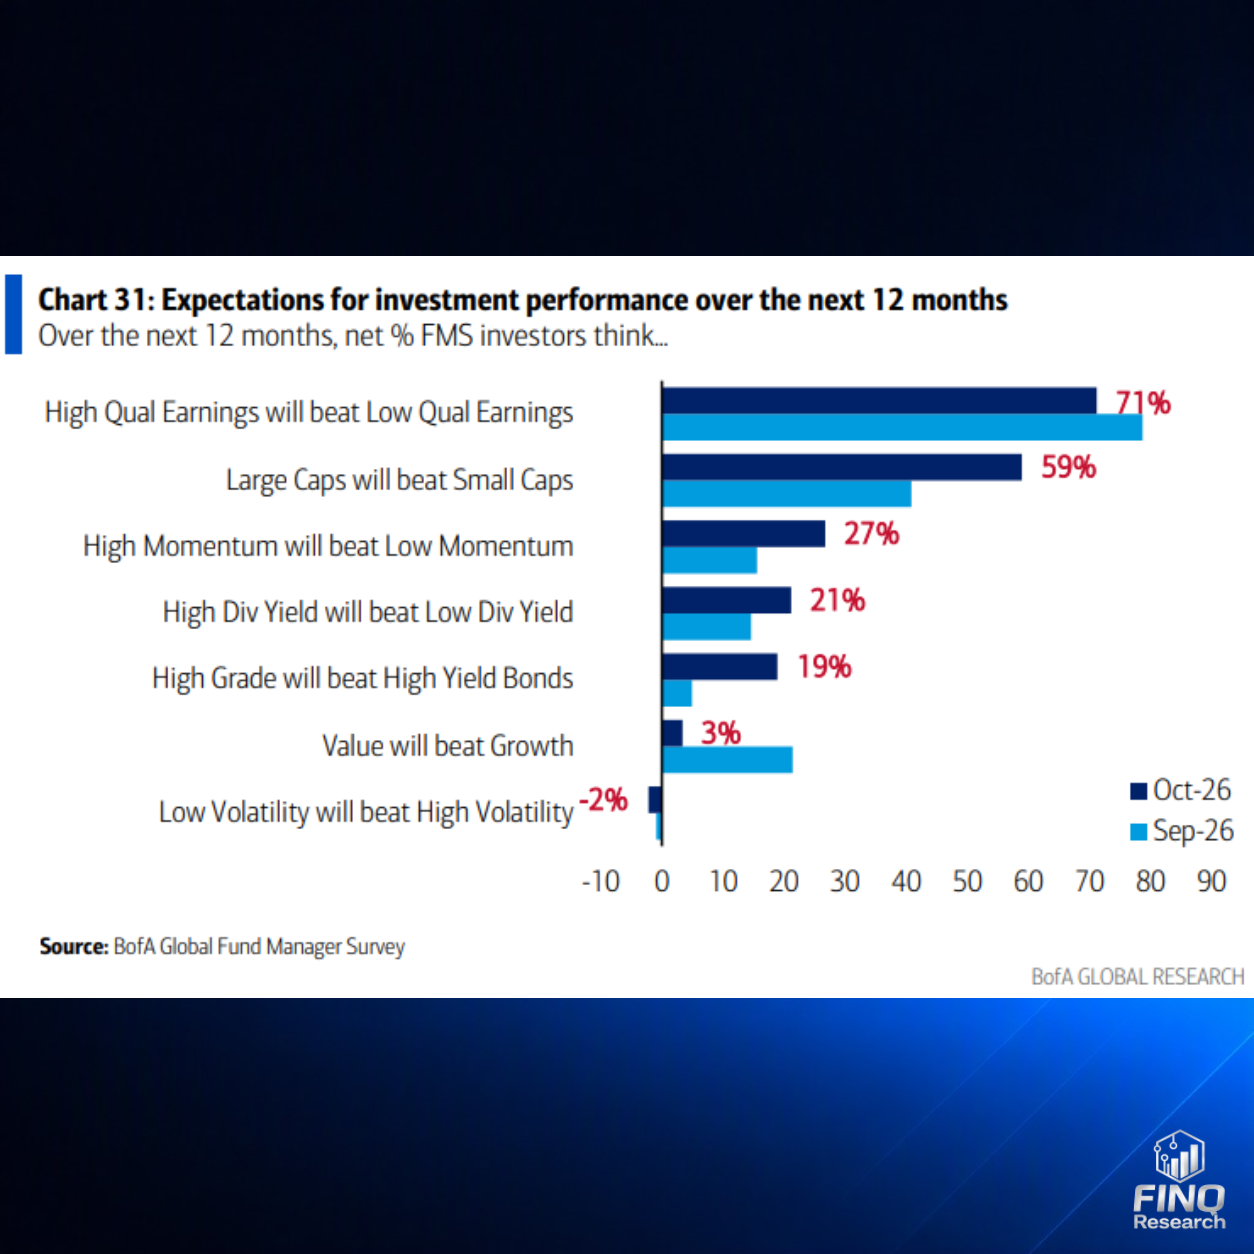
A net 71% expect companies with high-quality earnings to outperform those with low-quality earnings. A net 59% expect large companies to outperform smaller ones. Further preferences include high momentum at 27%, high dividend yields at 21%, and high-grade bonds over high-yield bonds at 19%.
The preference for value over growth is modest at 3%. For low versus high volatility, the net balance is even slightly negative at minus 2%. This suggests a selective preference for particular characteristics rather than equal enthusiasm for all defensive strategies.
The monthly comparison also deserves attention: quality remains clearly ahead, but support is below September's level. The preference for larger companies, by contrast, rises substantially. The message is therefore not simply “ever more quality,” but above all: quality remains the consensus, while large caps gain additional support.
Tech Stocks, Semiconductors and AI: How Big Is the Crowding Risk?
Technology Positioning Reaches Its Highest Level Since 2020
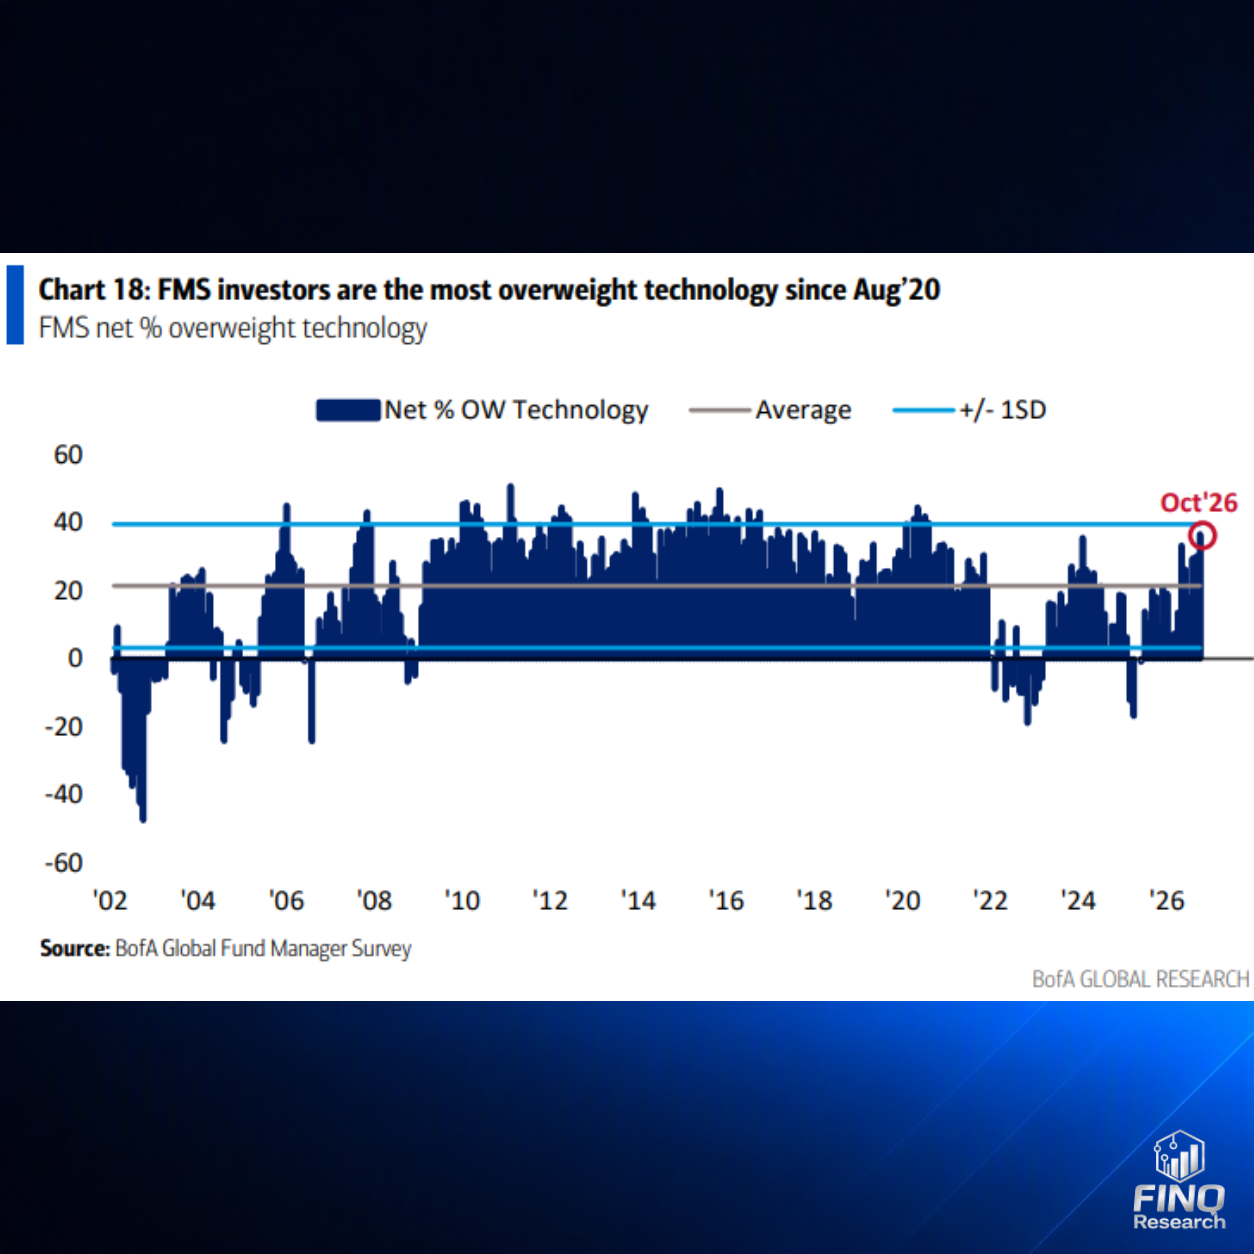
The net overweight in technology stands at 37%, its highest level since August 2020 according to the chart. It is approaching the plotted line representing one standard deviation above the historical average.
This shows a pronounced preference for the sector. It does not mean that 37% of all fund assets are invested in technology. Nor can a positioning survey alone establish whether these stocks are fundamentally overvalued.
Sector Comparison: Technology Leads, Consumer Sectors Lag
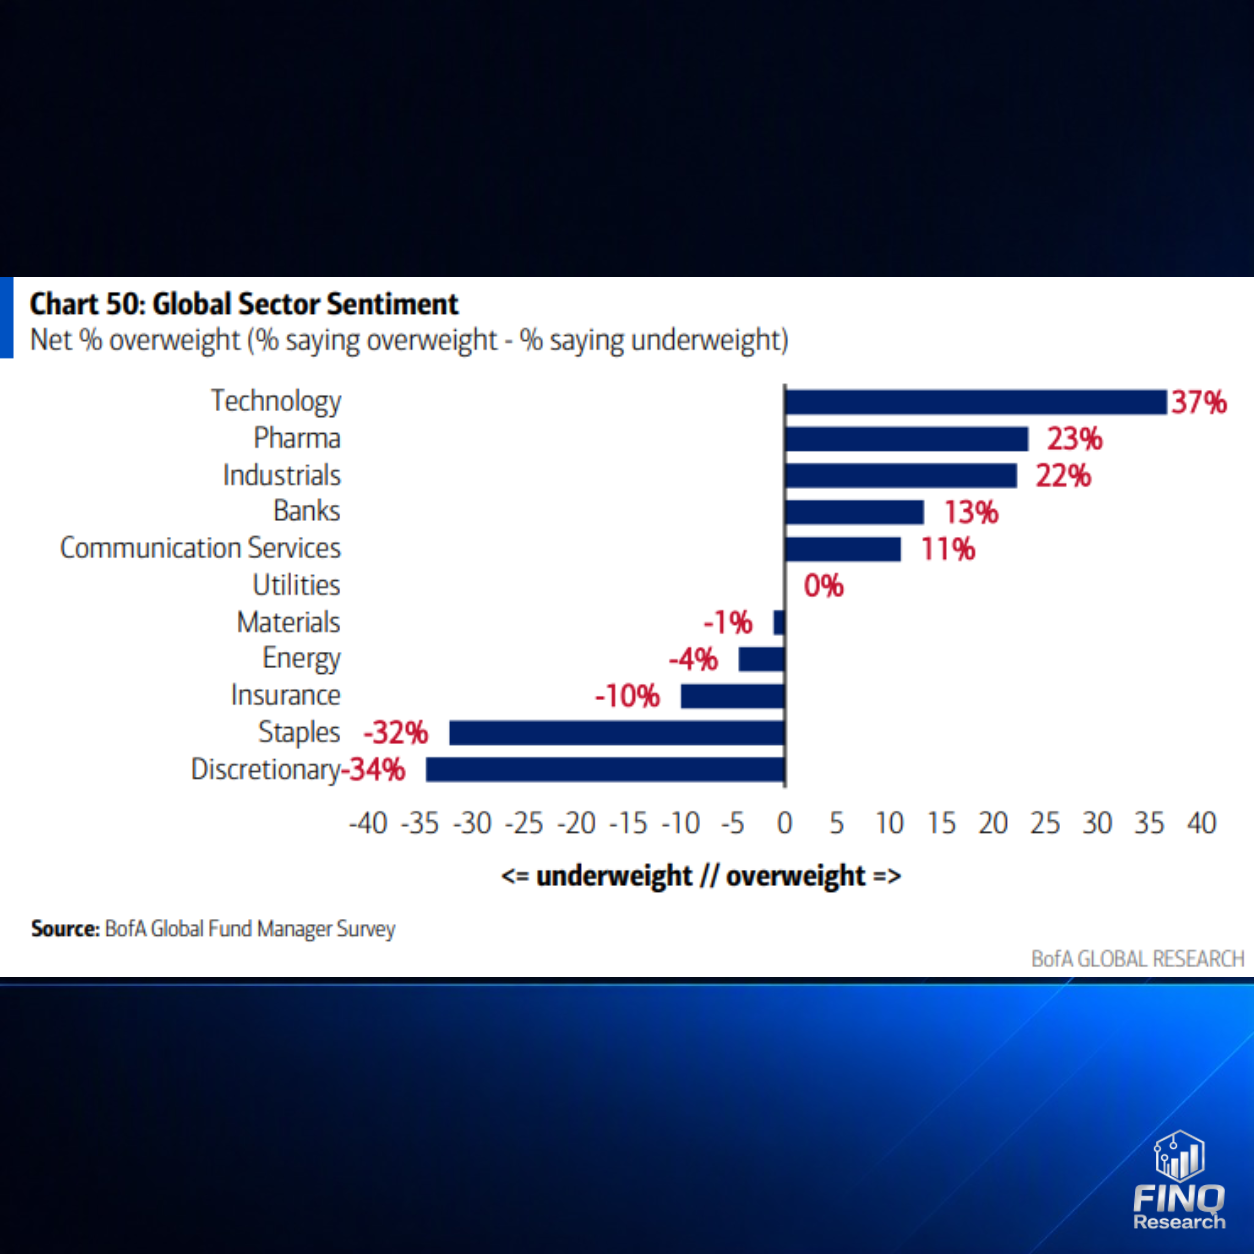
The cross-sector comparison confirms technology's leading position: it ranks first at a net 37%, followed by pharmaceuticals at 23% and industrials at 22%. Banks reach 13% and communication services 11%. Utilities are neutral on a net basis.
At the other end are consumer staples at minus 32% and consumer discretionary at minus 34%. The gap between technology and consumer discretionary therefore amounts to 71 percentage points in the survey balance. This illustrates the wide dispersion in preferences, without directly revealing the relative amounts of money actually invested.
Crowded Trades: Semiconductors, Treasuries and the Magnificent Seven
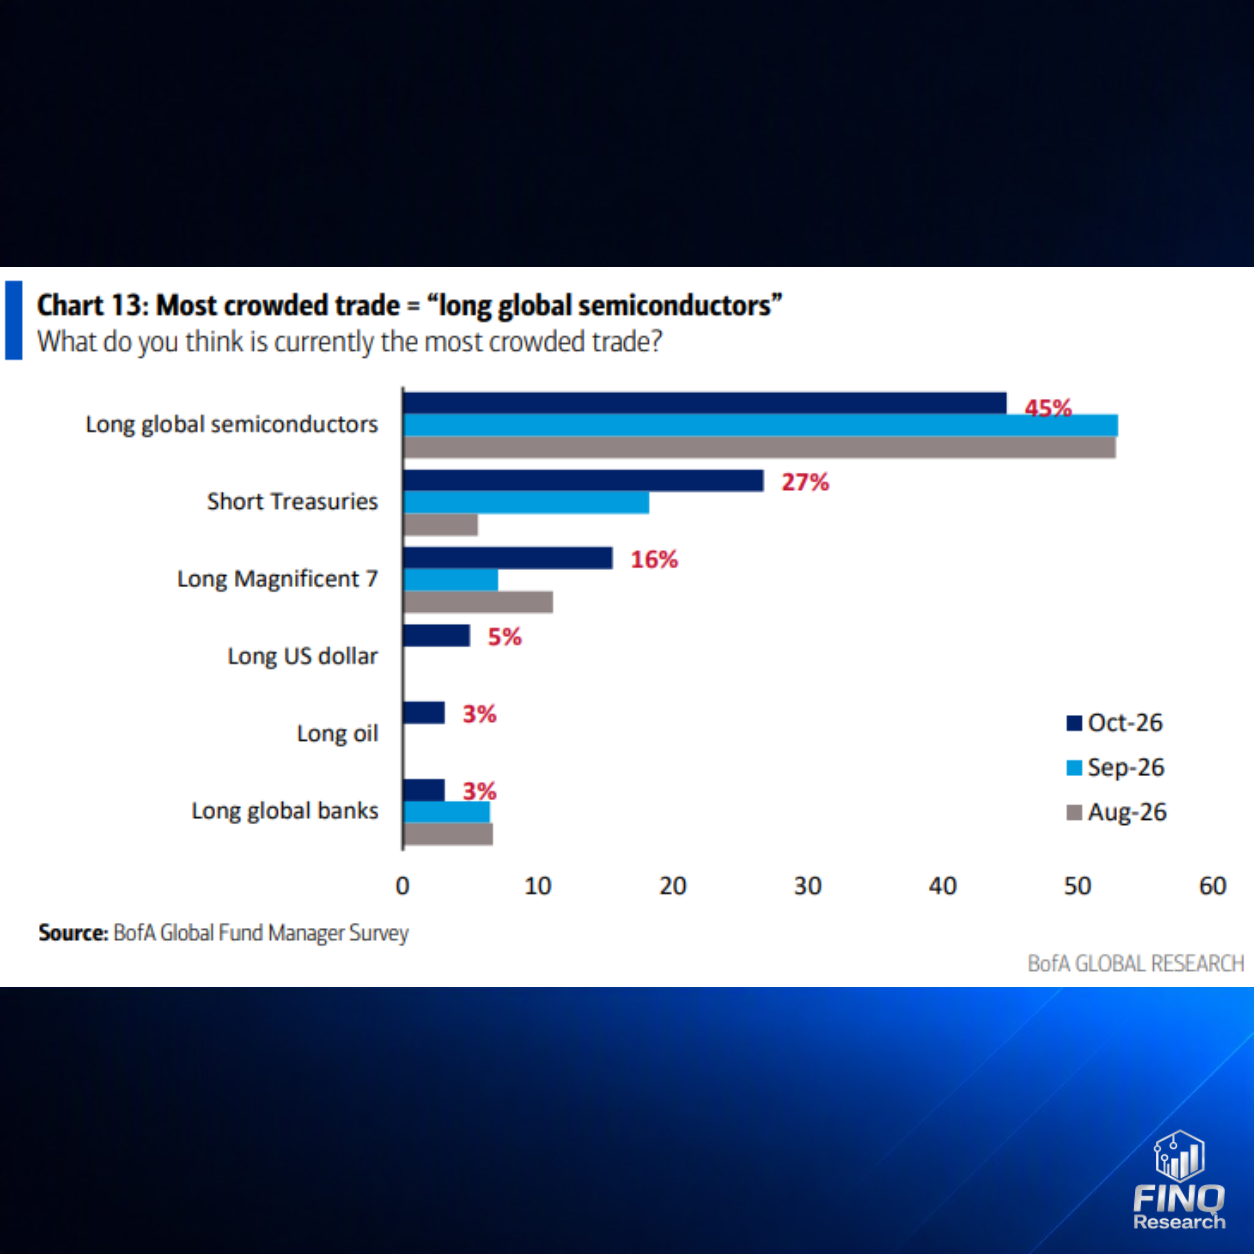
For 45%, a long position in global semiconductor stocks is the most crowded trade. Short positions in US Treasuries follow at 27%, and long positions in the Magnificent Seven at 16%.
The chart measures market participants' perceptions, not their own complete holdings. The change versus previous months is notable: semiconductors remain in first place but receive fewer mentions. Short Treasuries, by contrast, becomes visibly more prominent.
FINQ Research Insight: Technology remains a core consensus position. When many investors share similar convictions, disappointing news can encourage adjustments in the same direction. A crowded trade is not, by itself, a sell signal.
Consumer Stocks and Real Estate: Unpopular Sectors with Catch-Up Potential?
Consumer Discretionary: The Largest Underweight Since 2008
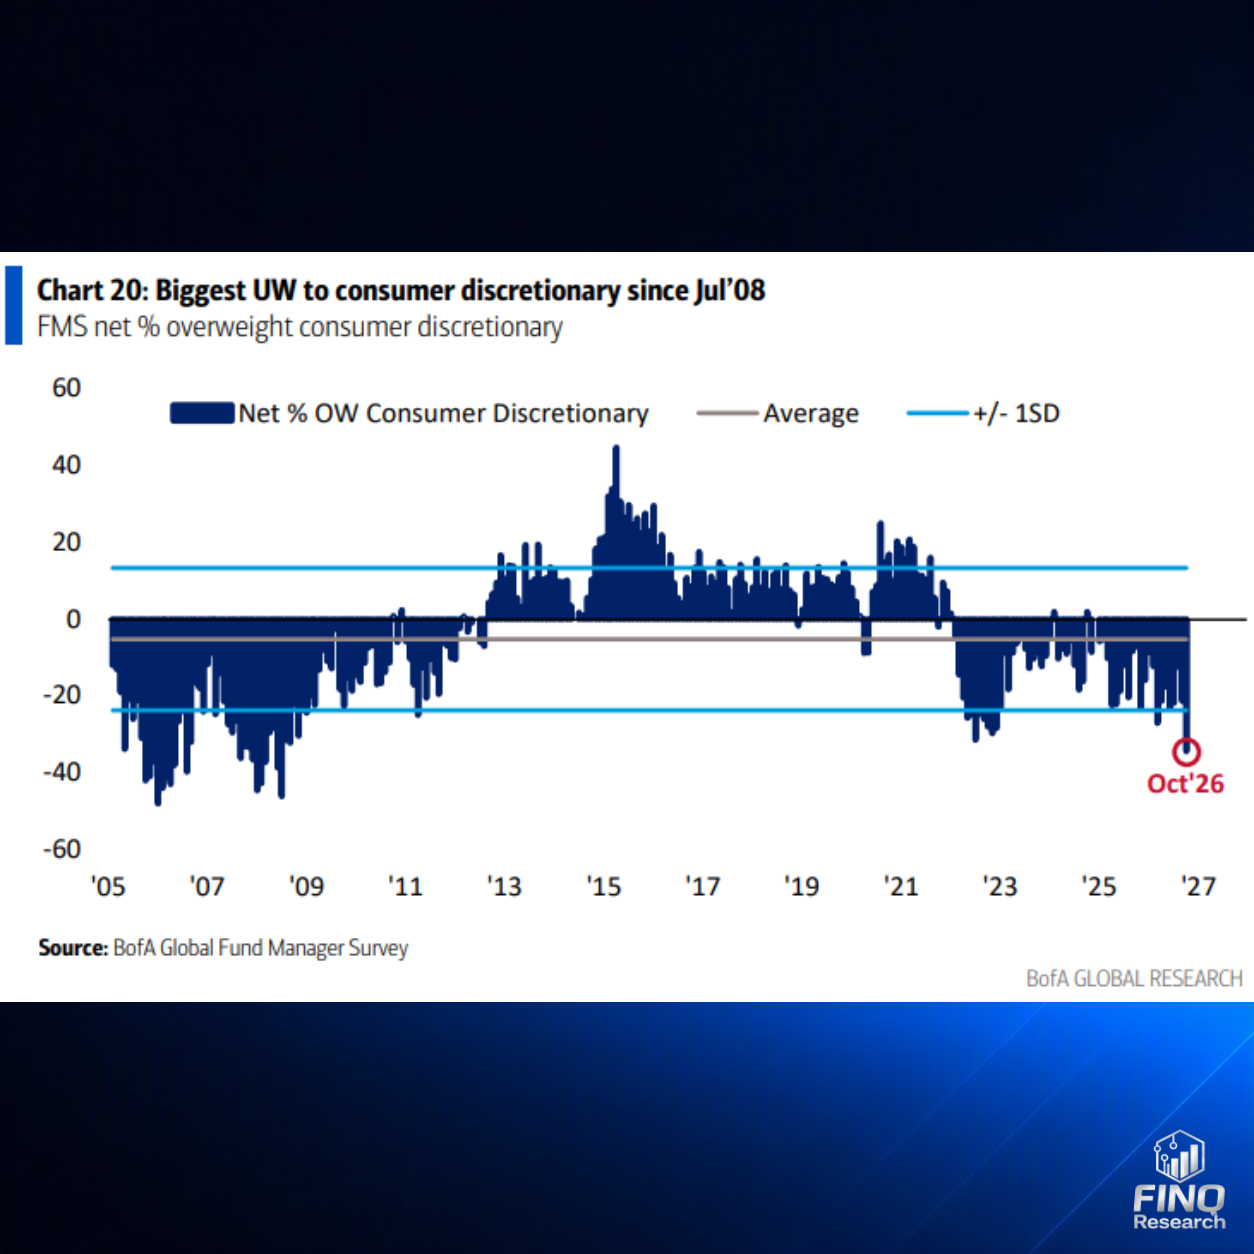
At a net minus 34%, consumer discretionary reaches its largest underweight since July 2008. The historical comparison highlights the extent of skepticism. It does not imply a repeat of the economic developments seen back then.
The connection with the sector comparison is notable: consumer staples are also heavily underweight, even though demand for their products is generally less sensitive to the economic cycle.
The aversion to consumer stocks therefore appears unlikely to reflect recession positioning alone. The charts do not establish what role relative earnings prospects or other sector-specific factors play.
Real Estate Stocks: Skepticism Remains Pronounced
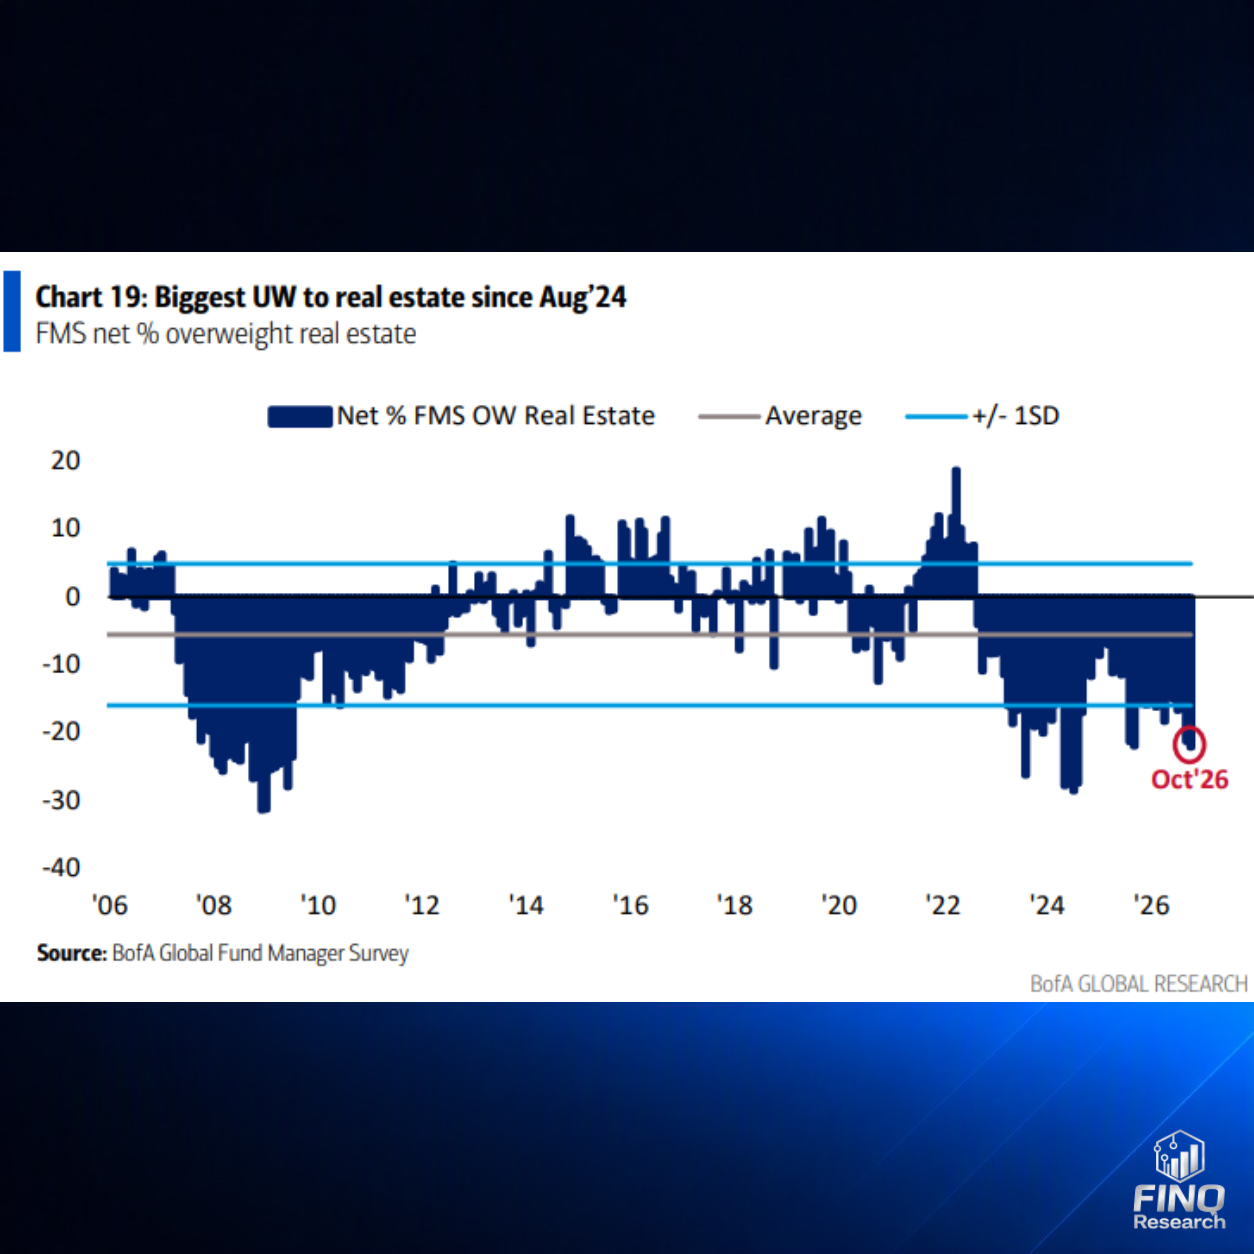
The net overweight in real estate stands at approximately minus 22%. According to the chart, this is the largest underweight since August 2024. The reading is below the plotted lower standard-deviation line, indicating historically pronounced caution.
The survey does not directly explain the causes. A deeper examination of the sector would need to consider financing costs, refinancing needs, rents and property valuations, among other factors. The underweight initially tells us how skeptically investors are positioned.
FINQ Research Insight: Unpopular sectors deserve attention because an already skeptical consensus can leave room for positive surprises. A sustainable recovery would also need to be reflected in company fundamentals and market behavior.
Sector Rotation and Asset Allocation: Are Bonds Gaining Ground?
Monthly Rotation: Bonds, Japan and the UK Gain
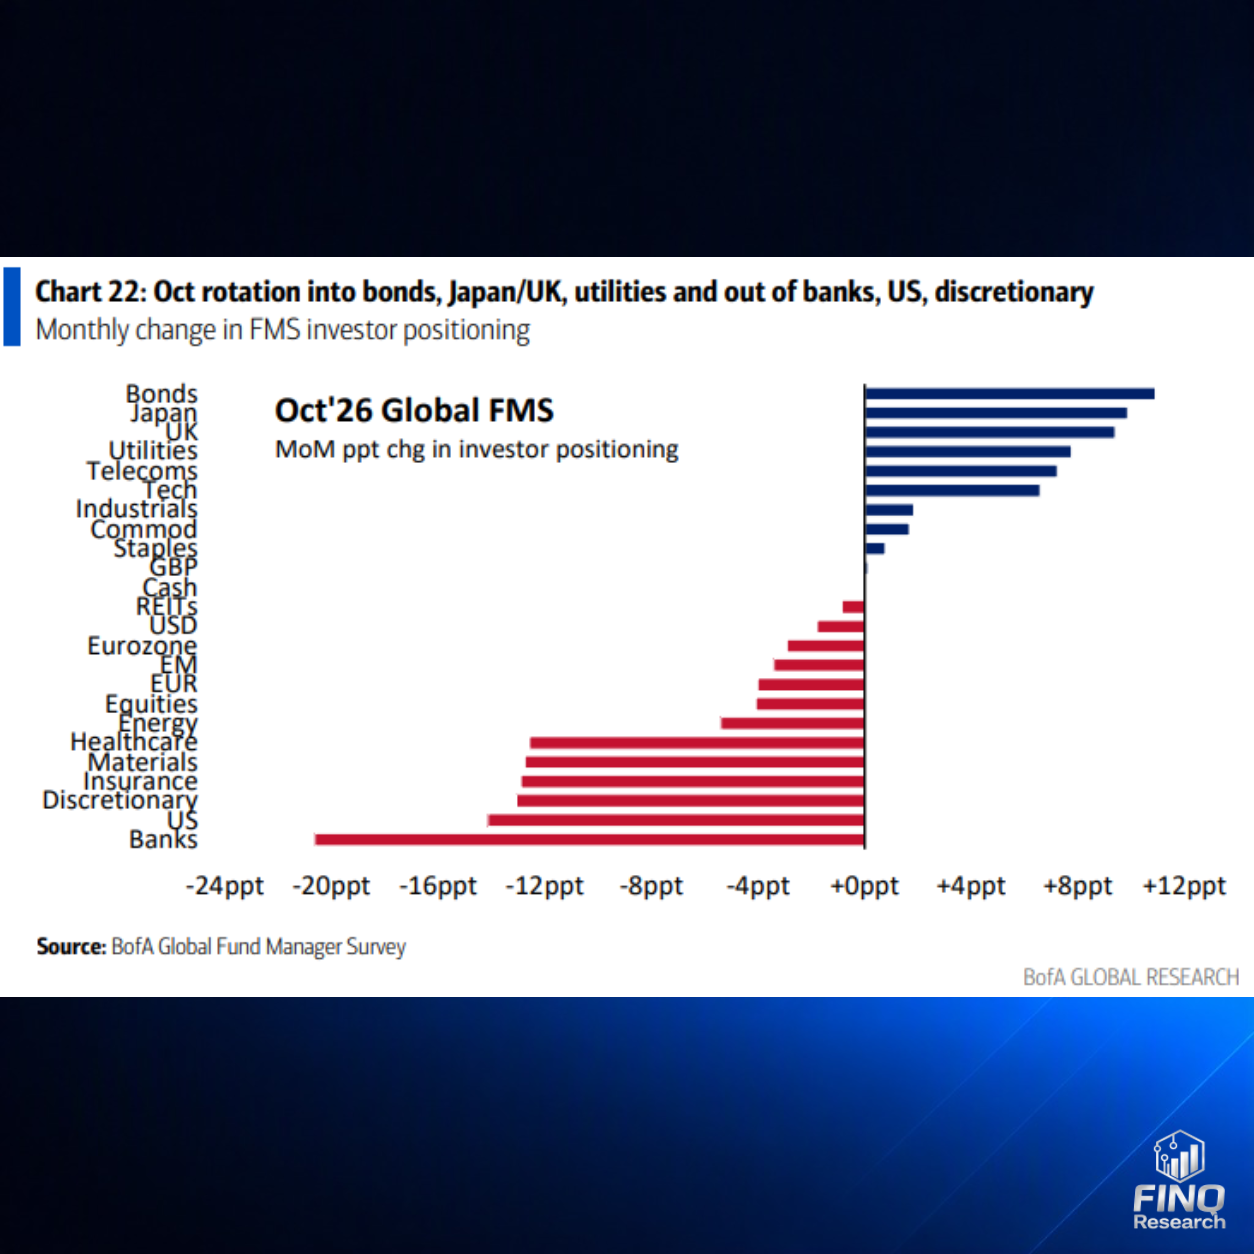
Month over month, positioning balances improve most notably for bonds, Japan and the UK. Utilities, telecommunications and technology also gain. Banks record the largest decline, followed by US equities and consumer discretionary.
These changes are measured in percentage points of survey positioning. They are not measured capital flows in euros or dollars. Nevertheless, the chart clearly shows where surveyed managers are changing their relative preferences.
Current Positioning: Equities Remain Clearly Favored
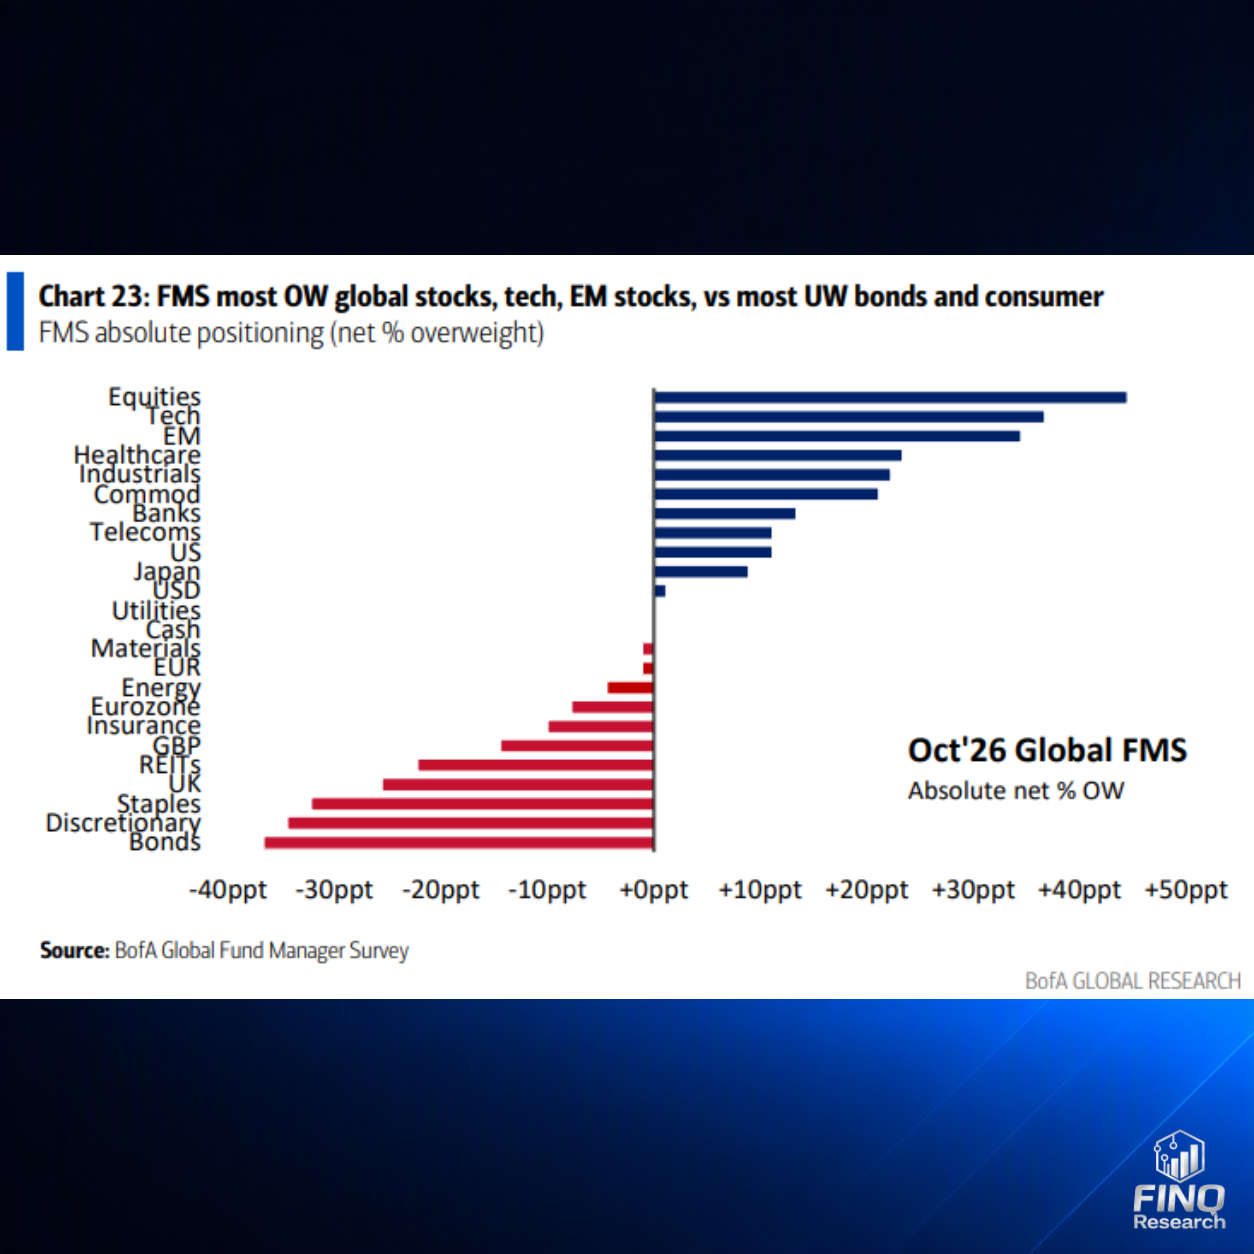
At current levels, global equities remain the most overweight category, followed by technology and emerging-market equities. Despite their positive monthly change, bonds remain at the bottom of the ranking. Consumer sectors and UK equities also remain underweight.
The two charts must be read together: less underweight does not yet mean overweight. Conversely, a sector can lose positioning support and remain favored, as the comparison shows for banks.
FINQ Research Insight: The data show a partial portfolio adjustment. Current positioning levels do not yet provide evidence of a broad shift from equities into bonds.
US Treasuries and Interest Rates: When Do Yields Become an Equity Risk?
Tail Risks: A Yield Shock Ranks Above an AI Bubble and Another Inflation Wave
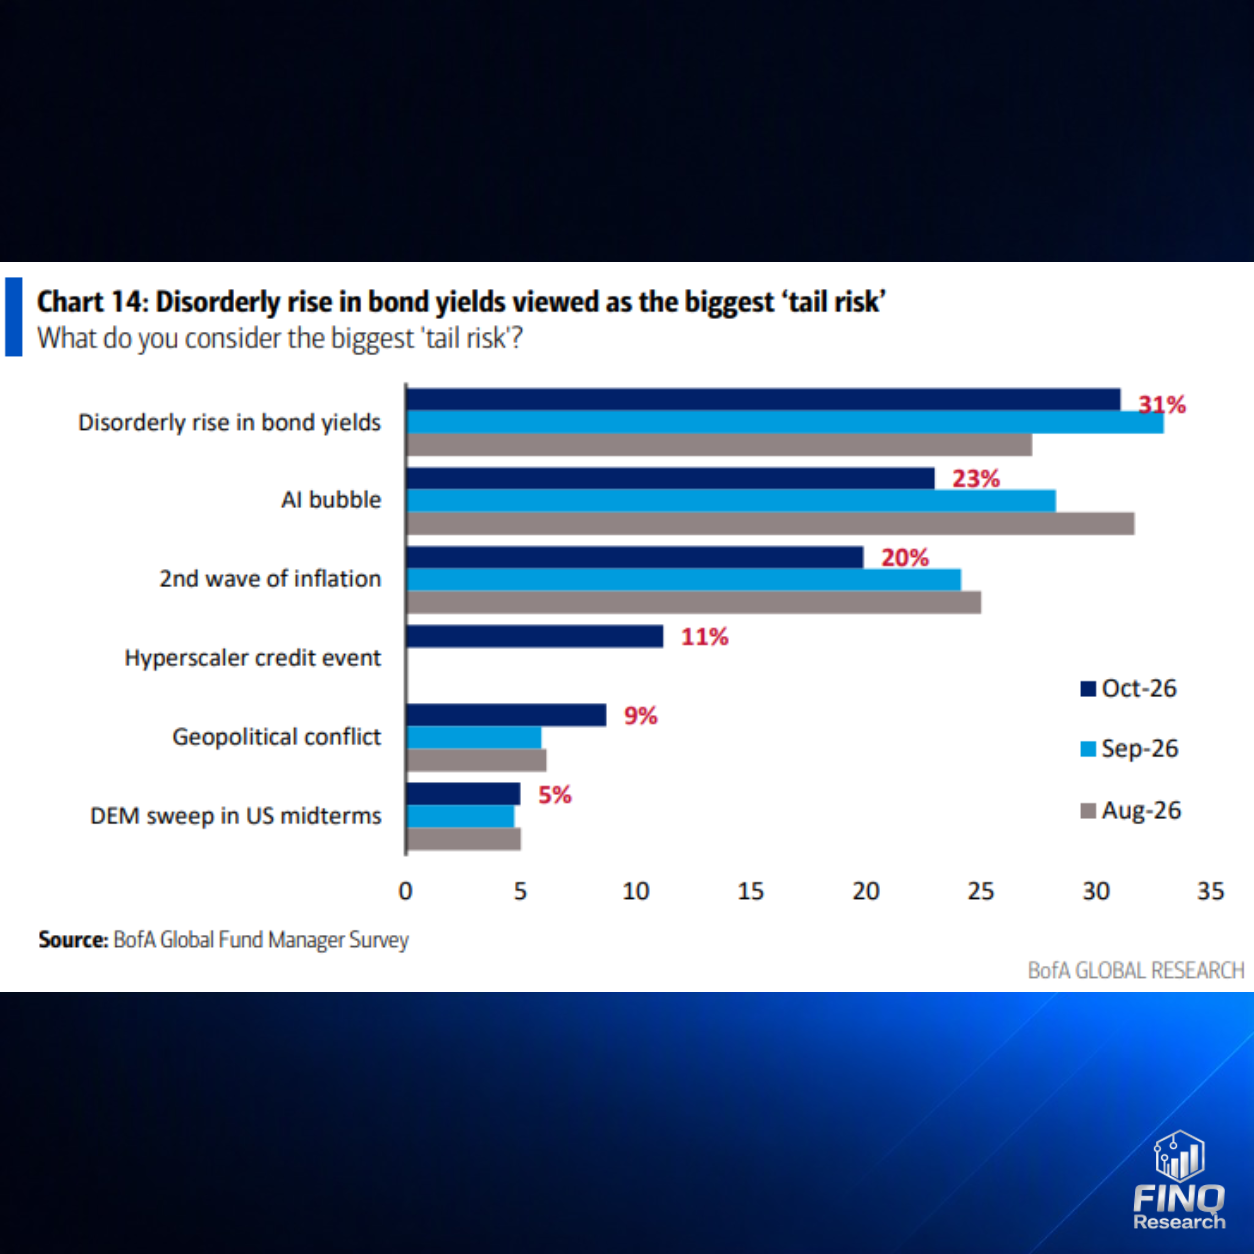
A disorderly rise in bond yields is the biggest tail risk for 31%. An AI bubble follows at 23%, a second wave of inflation at 20%, and a credit event at a major cloud or AI infrastructure provider at 11%. Geopolitical conflicts receive 9% of mentions.
These figures represent shares of responses to the question about the biggest risk. They are not probabilities of occurrence. In particular, 31% does not mean a yield shock has a 31% chance of happening.
Viewed alongside the other charts, a significant tension emerges: investors favor equities and technology, yet see the interest-rate environment as a potential source of disruption. Meanwhile, the bet against US Treasuries is increasingly viewed as crowded.
A 5.9% Treasury Yield: What the Survey Threshold Means
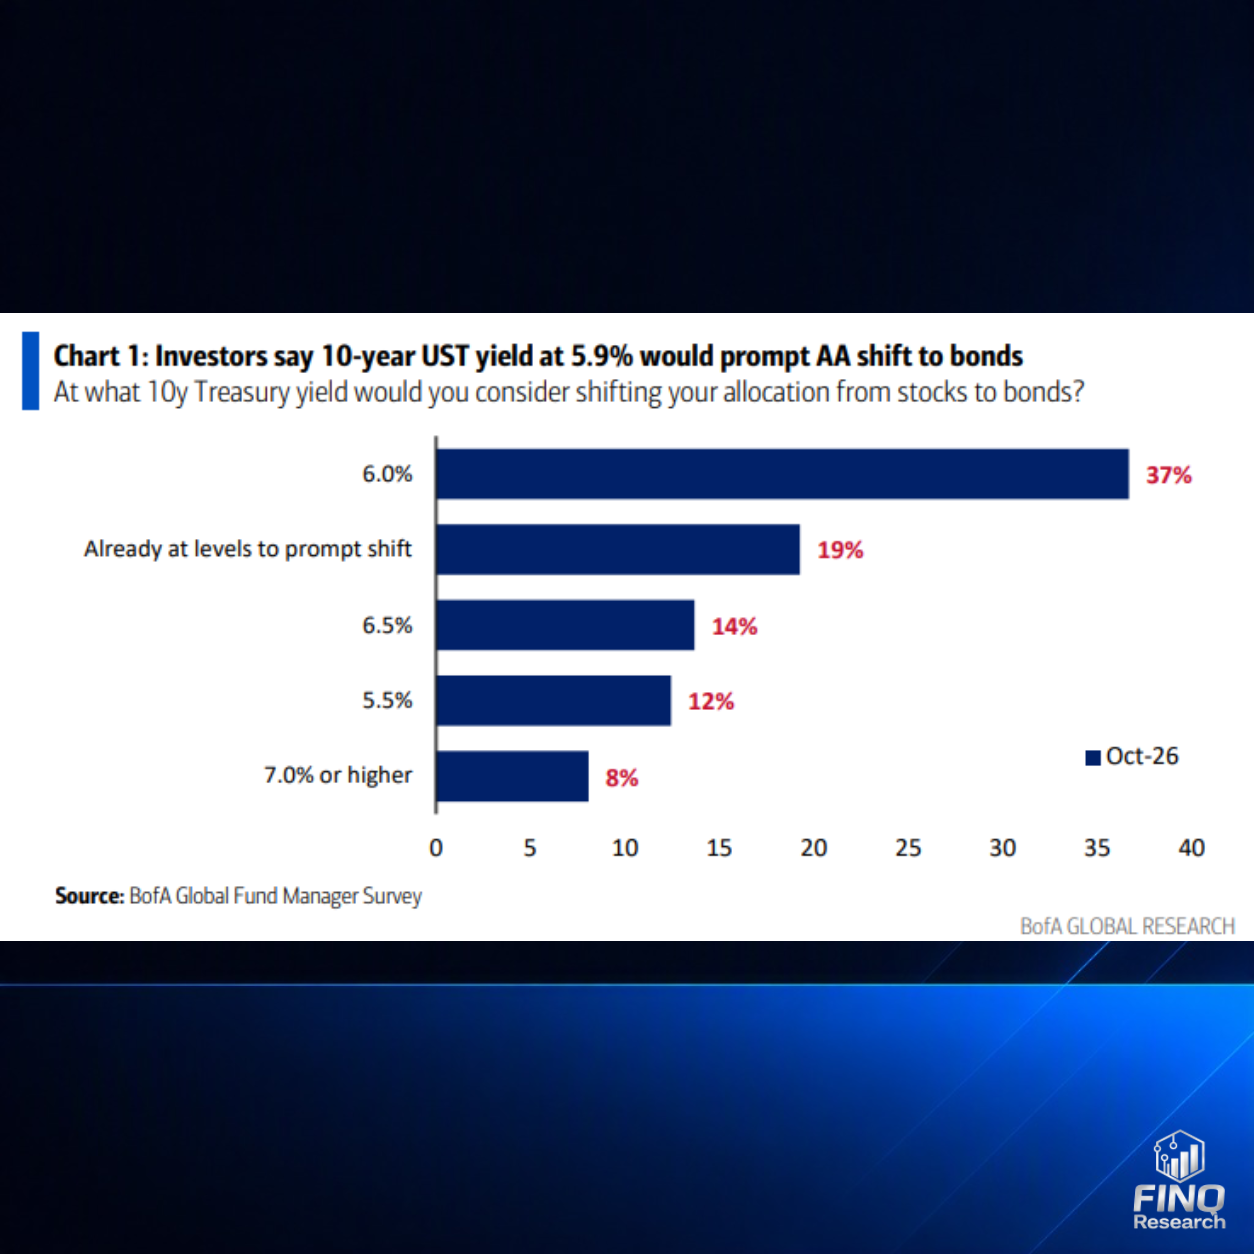
The final chart asks at what yield on ten-year US Treasuries investors would consider shifting from stocks to bonds. 37% cite 6.0%, 14% cite 6.5%, 12% cite 5.5%, and 8% cite at least 7.0%. For 19%, the existing level is already sufficient.
The headline summarizes the stated yield threshold as 5.9%. However, the visible response categories account for only 90%; the complete calculation cannot be reconstructed from the excerpt.
The 5.9% figure should therefore be read as a survey result reported by BofA. It is not a mechanical market threshold that automatically triggers selling when crossed. The responses describe hypothetical willingness to reallocate, with actual implementation dependent on the broader market environment.
FINQ Research Conclusion: What Matters for the Rest of the 2026 Market Outlook?
The 19 charts reveal a consistent tension. Fund managers remain positioned firmly toward equities, hold little cash and favor technology. At the same time, expectations for economic growth and strong earnings growth are losing support. Portfolios therefore reflect more risk appetite than some expectations indicators might initially suggest.
This is not an unambiguous crisis signal. The majority still expect the global economy to avoid a hard landing. The positive change in bond positioning also starts from a substantial underweight. Above all, the charts reveal a more selective approach within an overall stance that remains favorable to equities.
Three key questions emerge for the months ahead:
- Will corporate earnings validate the continued strong preference for equities? Cooling expectations increase the importance of the results companies actually deliver.
- Will demand broaden beyond the existing favorites? Consumer stocks and real estate stand in contrast to a strongly favored technology sector.
- Will the improvement in bond positioning persist? Several consecutive shifts would provide stronger evidence of a broader reallocation.
Our central conclusion: The market remains invested, but conviction is less unanimous. The decisive test lies in the interaction between earnings, interest rates and concentration in a small group of favorites.
Source: supplied charts from the BofA Global Fund Manager Survey, labeled October 2026; Chart 5 also cites Bloomberg. Analysis and interpretation: FINQ Research. The statements refer to this chart set and do not constitute personalized investment advice.