S&P 500 Valuation: Strong Fundamentals, Expensive Stocks, and Little Room for Error
FINQ RESEARCH | US EQUITY MARKET ANALYSIS
October 20, 2026
Companies in the S&P 500 continue to demonstrate strong profitability. At the same time, a closer examination of valuations reveals an increasingly differentiated picture.
Our latest FINQ Research data shows that the typical company in the S&P 500, measured by the median, trades at 16.9 times expected earnings. The arithmetic mean, however, stands at 20.7. Meanwhile, median net profit margins have recovered to 13.35%, while return on equity has increased to 17.05%.
However, the median Forward Equity Risk Premium stands at just 0.7 percentage points. This suggests that investors receive only a limited additional earnings yield relative to the interest rate benchmark used in our model.
The key question is: Can improving corporate fundamentals continue to justify current equity valuations?
To answer this question, we examine six key metrics of the S&P 500.
01 / Corporate Profitability: Profit Margins Remain Robust
Source: FINQ Research | Net Margin Distribution
Corporate profitability remains an important pillar supporting valuations in the US equity market.
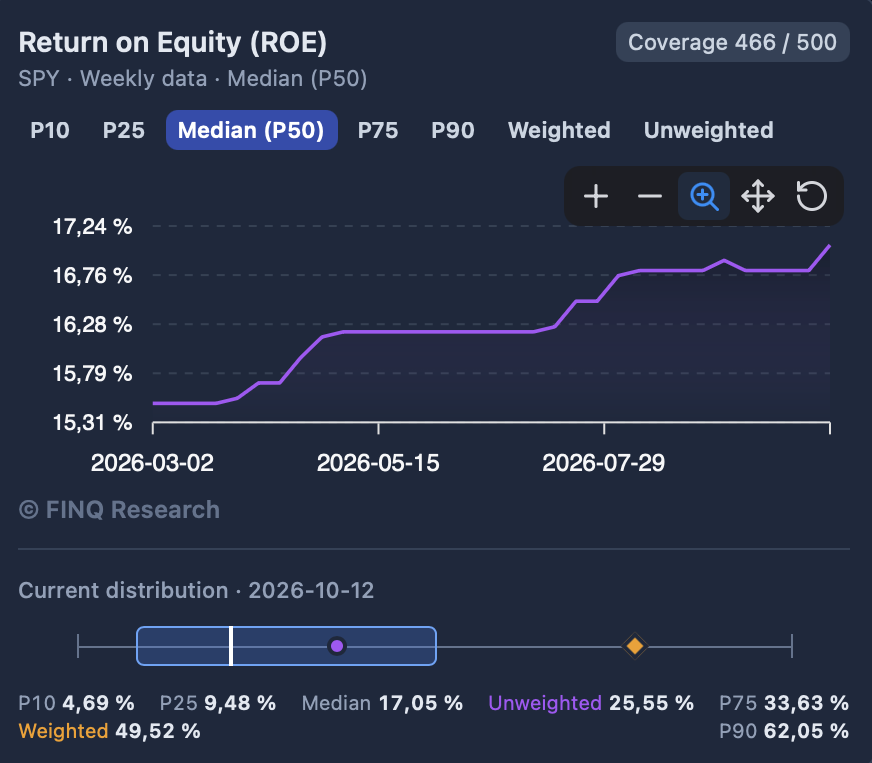
Our data shows that the median net profit margin among the S&P 500 companies covered has increased to 13.35%. At the beginning of 2026, it stood at approximately 12.9%.
However, the distribution reveals substantial differences within the index.
The market-capitalization-weighted net profit margin stands at 27.09%, more than twice the median. By contrast, the equal-weighted average reaches only 14.93%.
This significant difference highlights the influence of highly profitable large-cap companies on the overall earnings power of the index.
FINQ Research Conclusion:
Corporate profitability remains robust. However, the substantial gap between the median and the market-capitalization-weighted profit margin underscores the importance of index concentration.
02 / Return on Equity: Capital Efficiency Is Improving
Source: FINQ Research | Return on Equity
Return on Equity (ROE) provides another perspective on corporate profitability.
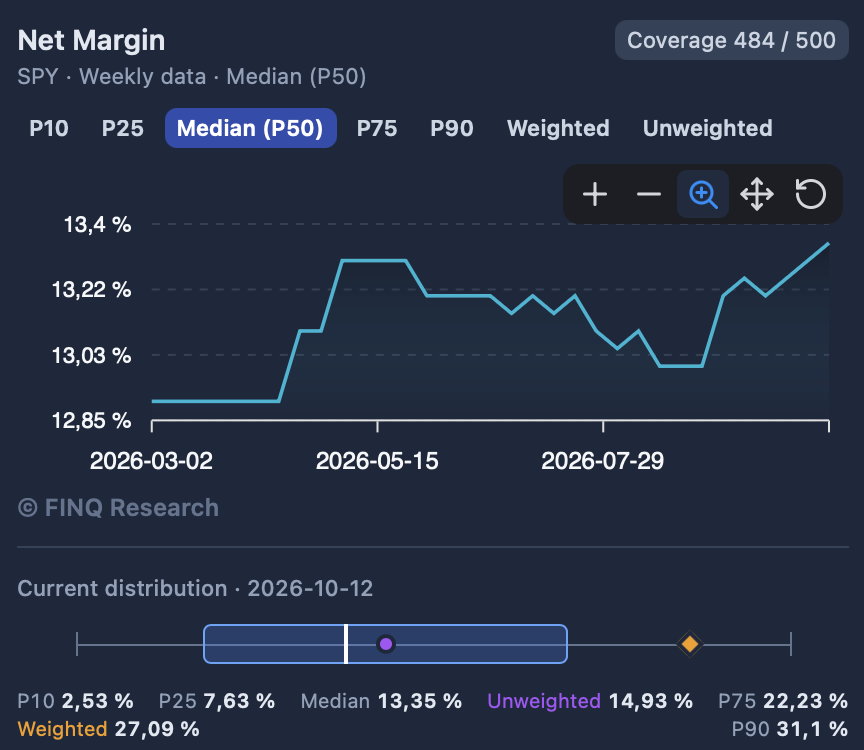
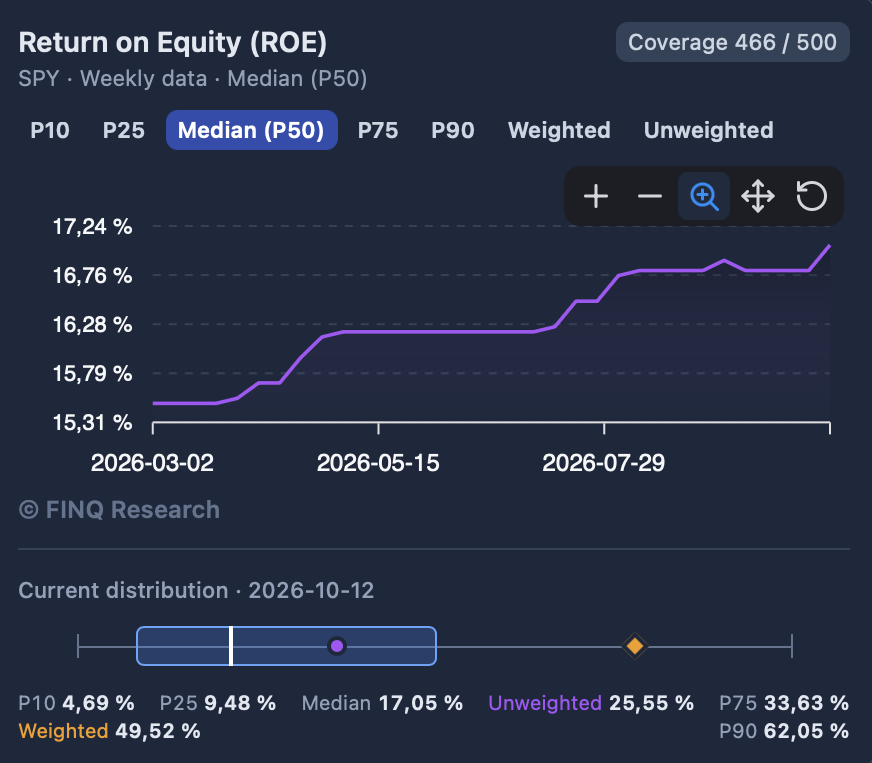
Our FINQ Research data shows that median return on equity has increased from approximately 15.5% in March to 17.05% in October 2026.
This development suggests that the typical company in the S&P 500 is now generating higher profits relative to its equity capital.
However, market-capitalization-weighted return on equity reaches 49.52%, while the equal-weighted average stands at 25.55%.
This substantial divergence once again illustrates how strongly the largest companies influence aggregate profitability metrics.
Nevertheless, a high return on equity can also result from increased leverage, share buybacks, or a relatively small equity base and does not necessarily reflect operational improvements alone.
FINQ Research Conclusion: Rising median return on equity supports the fundamental outlook. However, capital structure and index concentration remain important factors when assessing valuations.
03 / Forward P/E: Is the S&P 500 Really That Expensive?
Source: FINQ Research | Forward P/E Distribution
The S&P 500 is frequently described as expensive. However, aggregate valuation metrics can conceal substantial differences between individual companies.
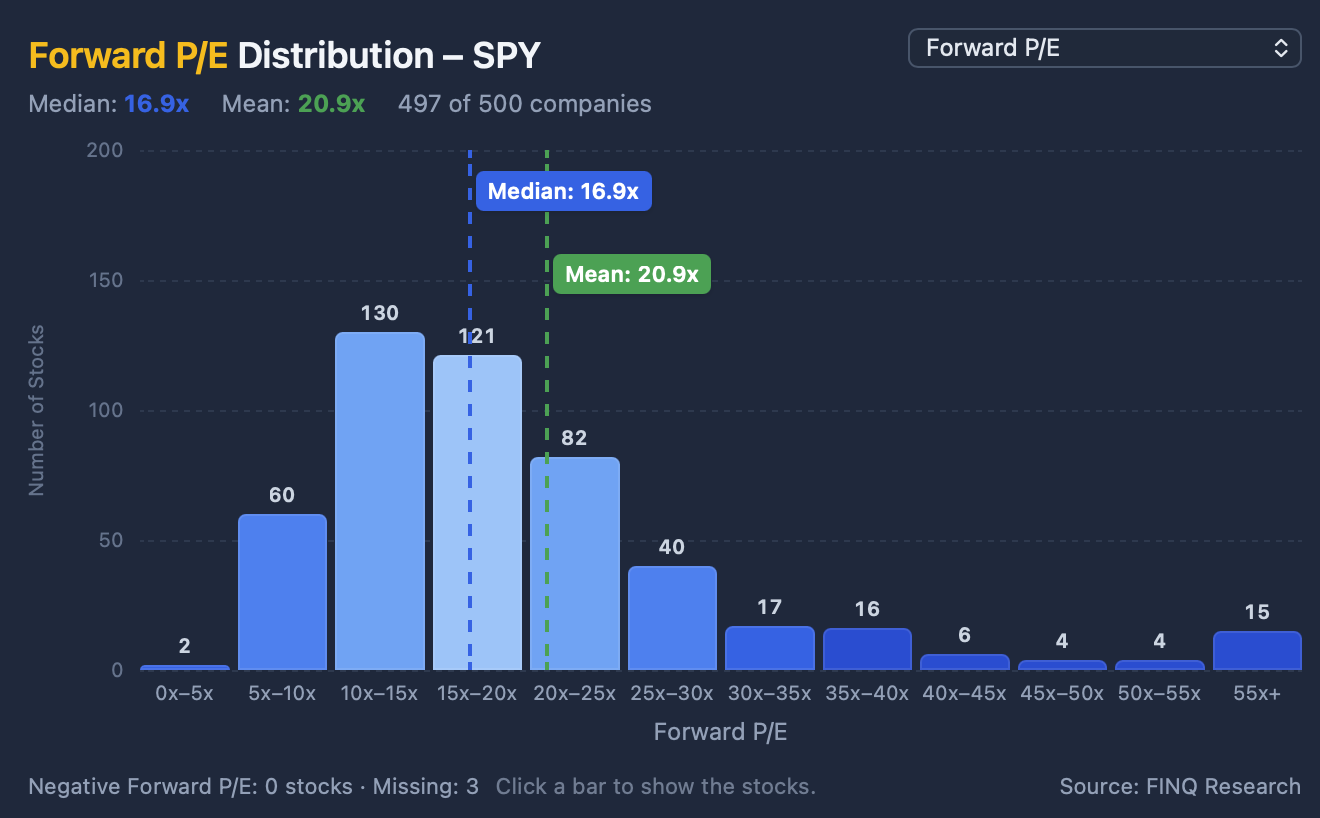
Our distribution shows a median Forward P/E ratio of 16.9, while the arithmetic mean stands at 20.9.
Approximately 63% of the companies covered trade at less than 20 times their expected annual earnings.
This demonstrates that elevated valuations are far from evenly distributed across the index.
However, a lower valuation multiple does not automatically mean that a stock is attractively valued. Earnings growth, profitability, and the broader interest rate environment remain decisive factors.
FINQ Research Conclusion: The typical company in the S&P 500 trades at a significantly lower earnings multiple than the arithmetic mean suggests. Valuation differences within the index are substantial.
04 / PEG Ratio: How Much Are Investors Paying for Growth?
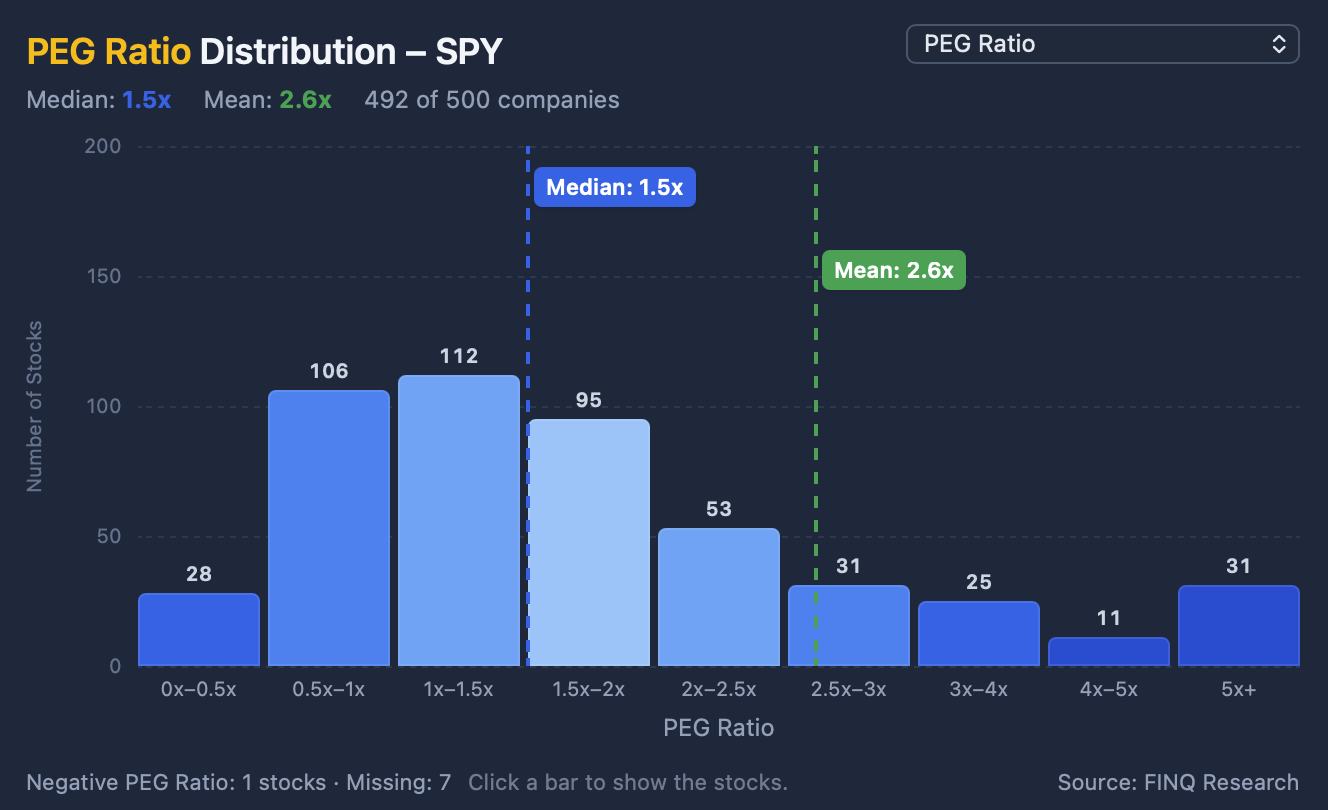
Source: FINQ Research | PEG Ratio Distribution
The PEG ratio compares the price-to-earnings ratio with expected earnings growth, providing a growth-adjusted measure of stock valuations.
Our latest distribution shows a median PEG ratio of 1.5, while the average stands at 2.6.
Of the 481 companies covered, 130 have a PEG ratio below 1.0. Another 110 companies fall between 1.0 and 1.5.
At the upper end of the distribution, 97 companies have a PEG ratio above 2.5.
The substantial difference between the median and the average indicates that a group of companies with particularly high growth-adjusted valuations significantly pushes the average upward.
However, the usefulness of the PEG ratio depends heavily on the underlying earnings growth expectations. A low ratio may indicate an attractive valuation, but it may also result from overly optimistic earnings forecasts.
FINQ Research Conclusion: Growth-adjusted valuations vary considerably. Investors should distinguish between companies whose growth is reasonably priced and those whose valuations depend on exceptionally strong earnings increases.
05 / Forward Equity Risk Premium: Limited Compensation for Equity Risk
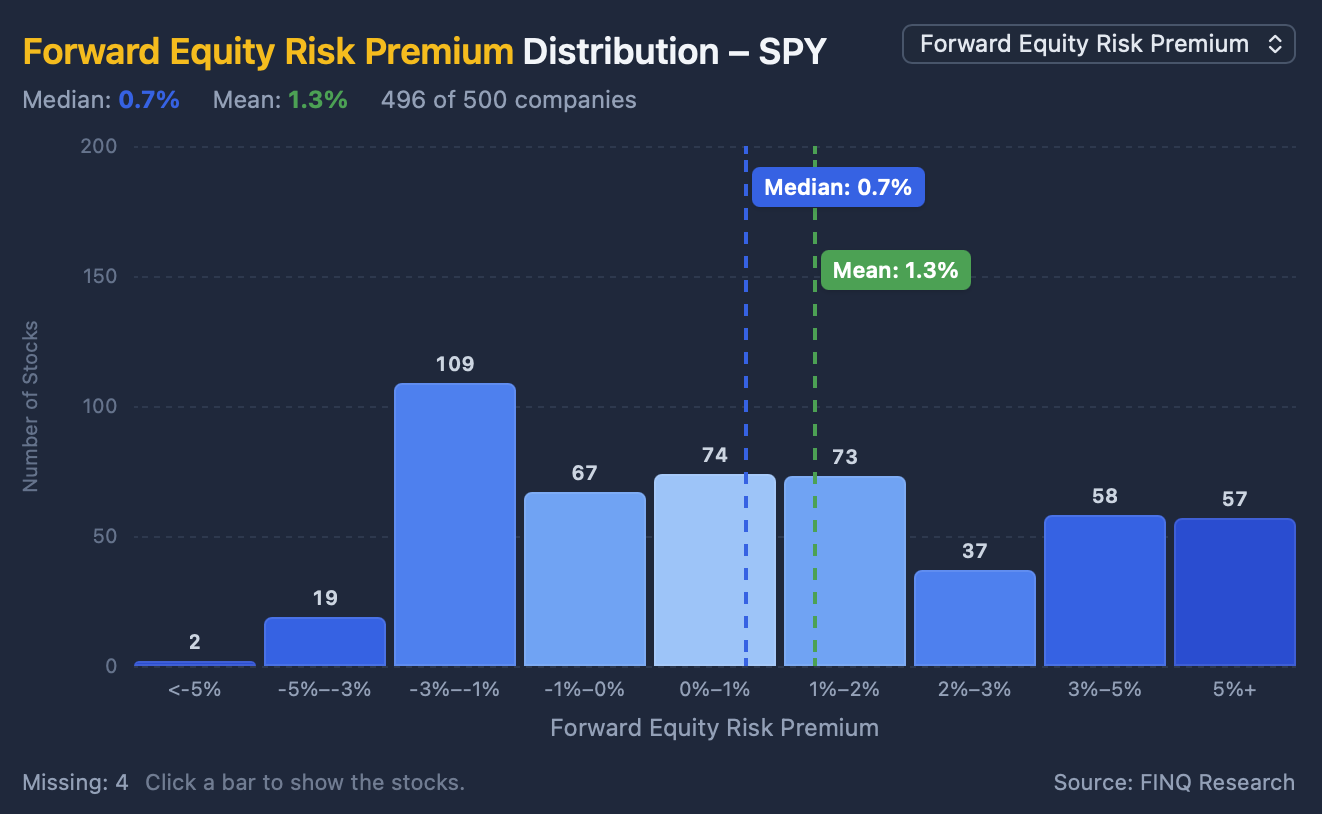
Source: FINQ Research | Forward Equity Risk Premium Distribution
One of the most important questions for equity investors is whether current valuations offer sufficient additional returns compared with bonds.
Our FINQ Research data shows a median Forward Equity Risk Premium of 0.7 percentage points, while the arithmetic mean stands at 1.3 percentage points.
Approximately 60% of the companies covered have a positive Forward Equity Risk Premium.
However, the median risk premium remains relatively low.
This means that expected earnings yields provide only a limited additional yield advantage over the interest rate benchmark used in our calculations.
As a result, the attractiveness of equities remains highly dependent on developments in earnings expectations and US Treasury yields.
If earnings forecasts improve, current valuations could become easier to justify. Disappointing corporate results or rising bond yields, on the other hand, could put pressure on valuation multiples.
FINQ Research Conclusion: Expected earnings yields offer a certain advantage over bonds. However, the low median risk premium leaves little room for declining earnings expectations or rising interest rates.
06 / Market Risk: Most S&P 500 Stocks Have a Beta Below 1
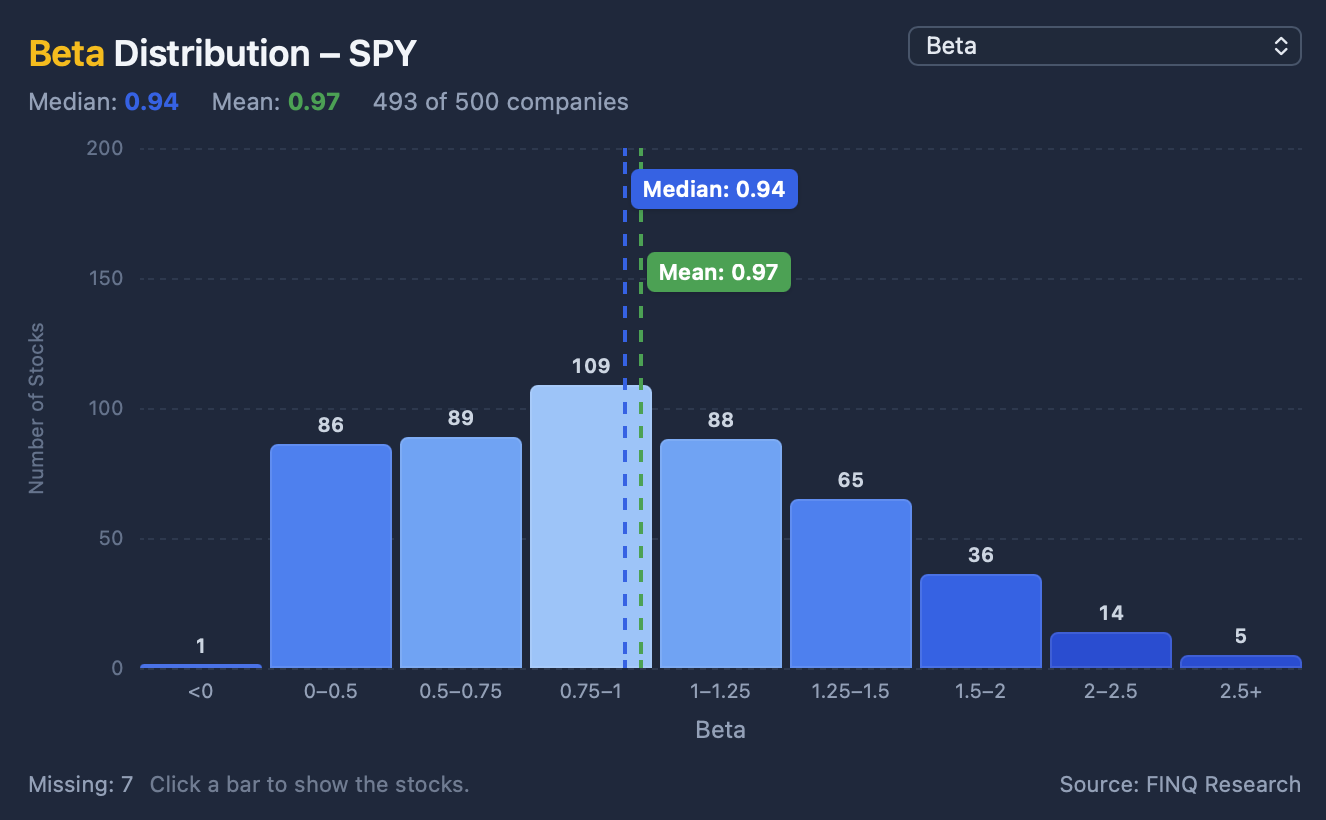
Source: FINQ Research | Beta Distribution
Beta measures how sensitively a stock has historically responded to movements in the broader market.
Our distribution shows a median beta of 0.94, while the average stands at 0.97.
Of the 480 companies covered, approximately 58% have a beta below 1.0.
At the same time, 55 companies have a beta above 1.5. Historically, these stocks have reacted significantly more strongly to market movements.
The distribution illustrates how widely the risk characteristics of individual companies within the S&P 500 can differ.
However, beta measures only historical sensitivity to the broader market, not the full spectrum of investment risk. Company-specific developments can lead to substantial price fluctuations even in stocks with low beta values.
FINQ Research Conclusion: The typical company in the S&P 500 exhibits slightly lower historical market sensitivity than the benchmark index. This highlights the importance of selective stock picking.
07 / FINQ Research Overall Conclusion
Strong Fundamentals, but Little Room for Error
The latest FINQ Research data reveals an equity market that continues to be supported by robust corporate profitability while exhibiting substantial valuation differences.
Three developments stand out in particular.
1. Corporate profitability remains high.
A median net profit margin of 13.35% and a return on equity of 17.05% demonstrate that the typical company in the S&P 500 continues to generate solid earnings.
However, the significantly higher market-capitalization-weighted figures highlight the considerable influence of the largest companies.
2. Not all stocks are equally expensive.
The median Forward P/E ratio of 16.9 and the median PEG ratio of 1.5 show that the typical company trades at considerably lower valuation multiples than the arithmetic averages suggest.
This creates a differentiated market environment in which the selective identification of individual companies is becoming increasingly important.
3. The equity risk premium remains the central challenge.
A median Forward Equity Risk Premium of just 0.7 percentage points suggests that investors receive only a limited additional earnings yield advantage over bonds.
Consequently, sustained earnings growth and stable interest rates remain important prerequisites for supporting current valuations.
BOTTOM LINE
The S&P 500 combines robust corporate profitability with demanding relative valuations.
While the typical company is valued more attractively than some aggregate valuation metrics might suggest, low expected equity risk premiums leave limited room for disappointment.
The decisive question is therefore no longer simply whether companies can continue to grow their earnings.
It is whether that earnings growth will be sufficient to justify the prices investors are already paying for these companies today.
Methodology: The profitability and valuation distributions are based on the S&P 500 companies covered in the analysis. Weighted averages account for each company's respective market capitalization. The Forward Equity Risk Premium represents a comparison based on expected earnings yields relative to the interest rate benchmark used in the FINQ Research model and should not be interpreted as a forecast of actual excess returns.
Disclaimer: This publication is intended solely for informational and research purposes and does not constitute investment advice or a recommendation to buy or sell securities.