BofA November 2026 Survey: Investors Scale Back Tech — Is the AI Consensus Turning?
Fund managers remain invested in equities, but their convictions are shifting significantly. Bank of America’s November survey shows the largest monthly decline in tech overweight positioning since June 2006, growing doubts about AI investment and a rotation toward bonds and consumer sectors.
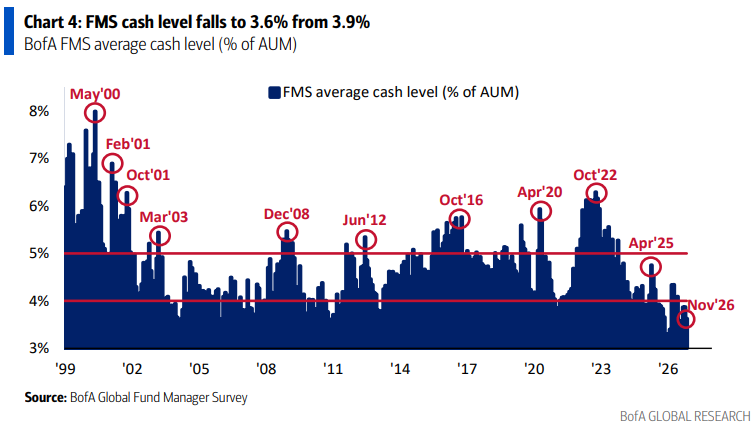
Average cash holdings fall to 3.6% while the technology overweight declines sharply. This contrast defines the latest Global Fund Manager Survey: Investors are not broadly withdrawing from markets but changing which risks they want to take.
In our view, the central development is less a complete reversal in sentiment than a reassessment of the prevailing AI and growth narrative. How far has this adjustment already progressed?
Key Takeaways
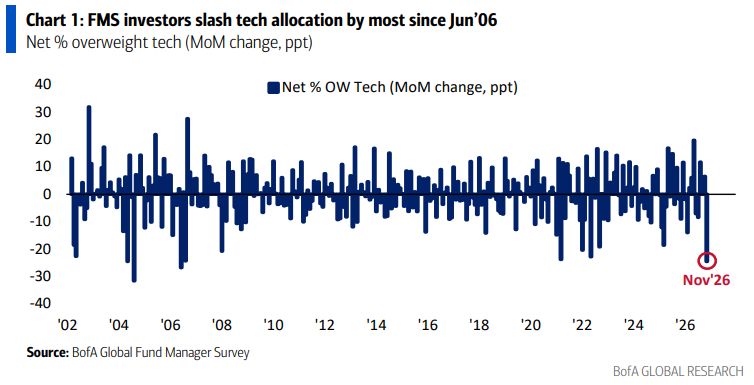
- Tech positioning falls from a net 37% overweight to a net 12% overweight.
- 52% expect an AI hyperscaler to announce a capex cut within six months.
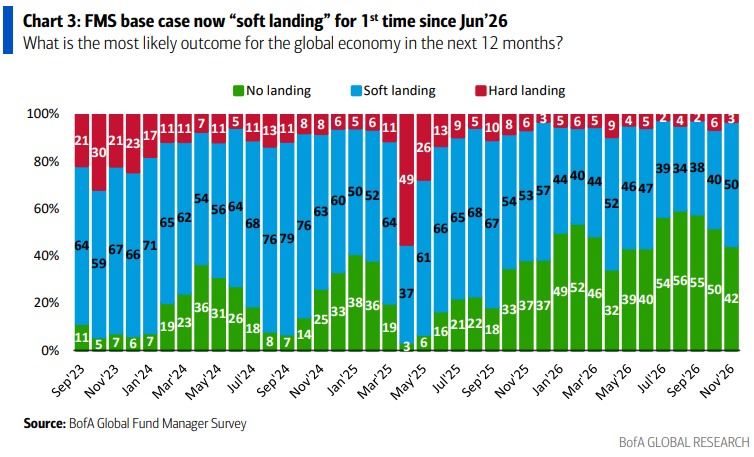
- Soft landing is once again the most frequently selected economic scenario, at 50%.
- Allocations to bonds and consumer sectors increase, but both remain underweight.
- Low cash holdings and a clear preference for quality coexist with growing AI skepticism.
Less Boom, but Few Expect a Hard Landing
50% of respondents expect a soft landing for the global economy over the next twelve months. For the first time since June 2026, this scenario leads no landing, at 42%. Just 3% select a hard landing. The categories shown do not add up to 100%; the remaining responses are not explained in the extract.
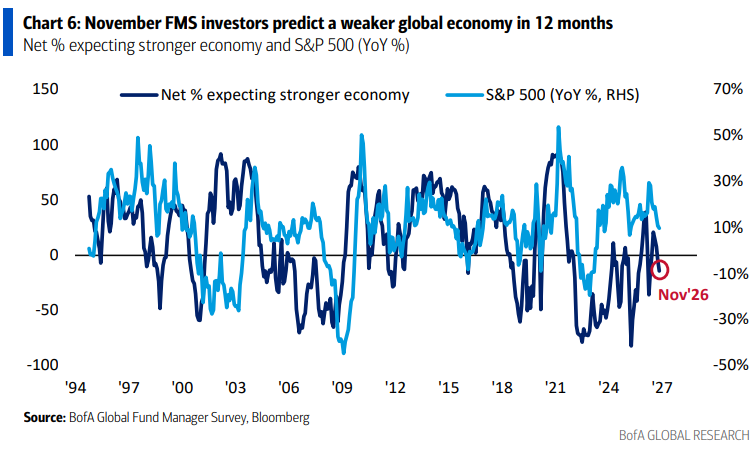
The development in growth expectations fits this picture: A net 14% anticipate a weaker global economy. This reflects expectations of slower economic momentum, rather than evidence of an impending recession. The chart’s comparison with annual S&P 500 performance also illustrates a historical relationship, without providing a reliable price target or timing signal.
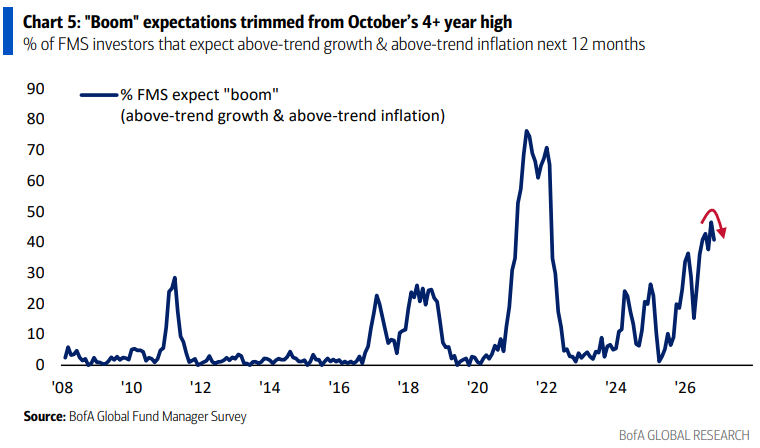
Meanwhile, the share expecting above-trend growth and above-trend inflation falls from 47% to 41%. This separate “boom” question should not be treated as equivalent to the no-landing question.
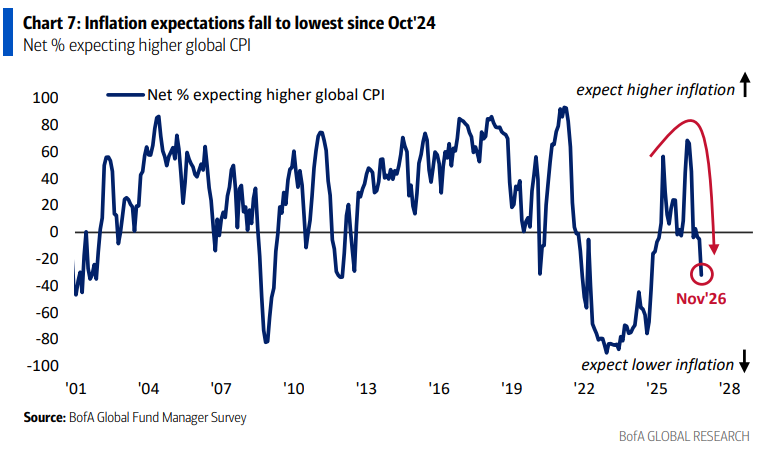
On inflation expectations, responses favoring lower global inflation lead by a net balance of 32%. Expectations are therefore at their lowest since October 2024. This establishes neither a specific inflation rate nor an existing decline in the price level.
The overall picture: Investors expect a more moderate path for growth and inflation. For capital markets, this could support bonds and more defensive earnings profiles, provided the economic slowdown remains contained.
Doubts Focus on the Economics of AI Investment
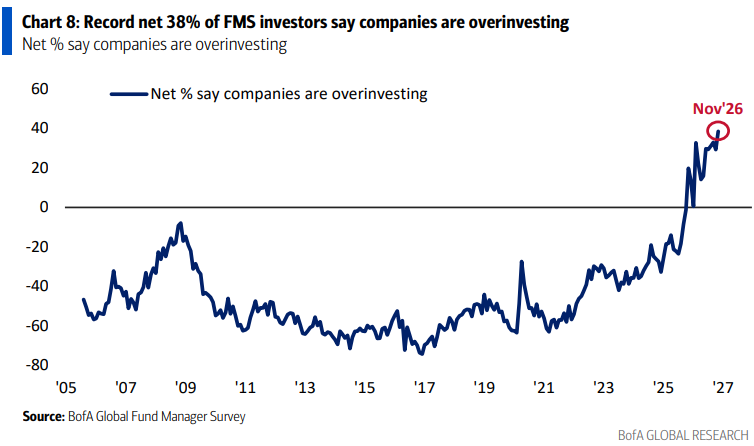
A record net balance of 38% considers corporate investment excessive. This is not a simple 38% share of all respondents. BofA interprets the finding as a call to slow the pace of AI investment.
Expectations become more specific for major cloud and AI infrastructure providers: 52% expect an AI hyperscaler to announce a reduction in capital expenditure within the next six months. The figure was 30% in October, an increase of 22 percentage points. In November, 40% answer no.
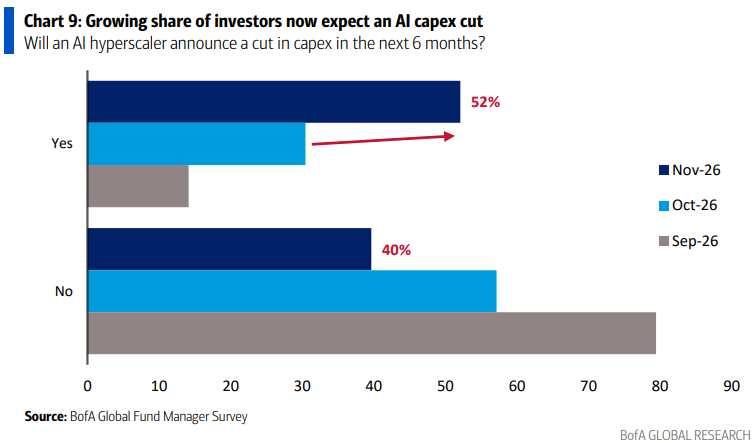
These responses document changing expectations. They do not establish that a cut has already been approved, nor do they indicate that total AI investment will decline.
For investors, the implications also run in two directions: Lower capex could relieve pressure on an investing company’s free cash flow, while suppliers could face weaker orders. The scale, timing and reason for a potential adjustment would be decisive.
AI Replaces Inflation at the Top of the Risk List
34% identify an AI bubble as the biggest market tail risk. An AI hyperscaler credit event follows at 31%. A second wave of inflation receives 14%, and a disorderly rise in bond yields 13%.
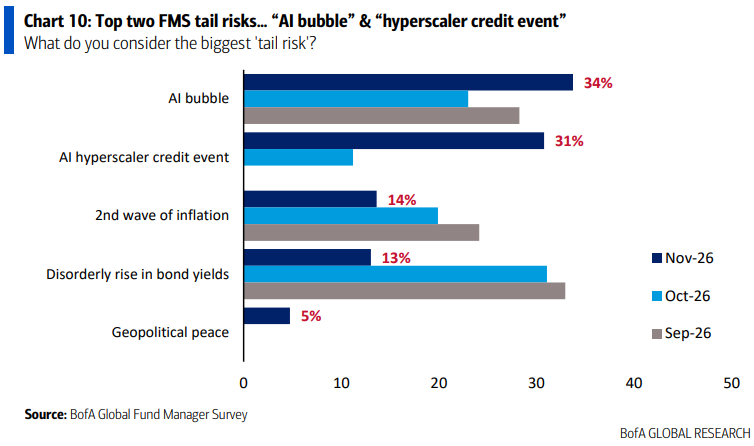
These figures measure which risk respondents prioritize. They are not probabilities of those events occurring. A credit event should also be understood more broadly than a specific forecast of default.
The combination of operating and financial skepticism is notable: Investors are questioning both the returns on large AI investments and the risks associated with financing them.
Technology Remains Overweight
The tech positioning balance falls from a net 37% overweight to a net 12% overweight. The change amounts to minus 25 percentage points, the largest monthly reduction since June 2006 according to BofA.
This does not mean funds sold a quarter of their tech holdings or that their tech allocation stands at 12%. The measure subtracts the share reporting an underweight from the share reporting an overweight.
Consistent with this, “long global semiconductors” remains the most frequently identified crowded trade: 39% name this positioning. The figure stood at 82% in July. Short China follows at 14%, and long Magnificent Seven at 12%.
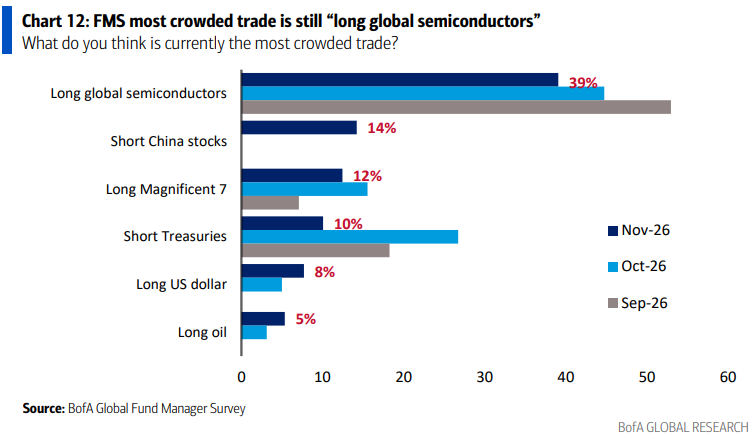
Perceived crowding has diminished but has not disappeared. The responses neither measure actual short positions nor establish that selling is imminent.
Rotation Favors Consumers, Healthcare and Bonds
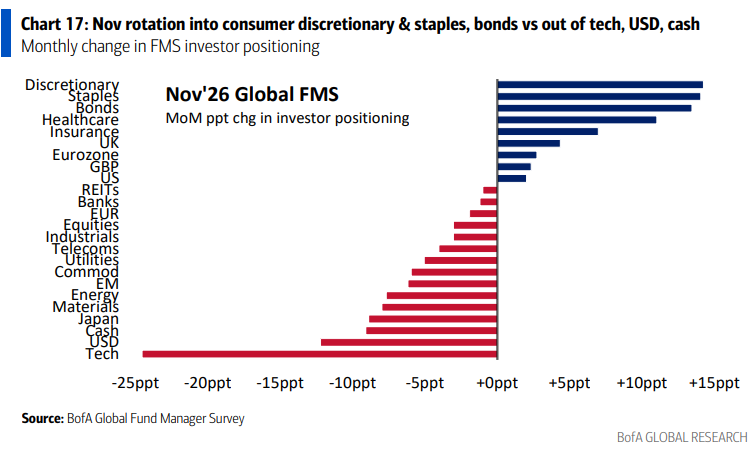
The monthly changes show the strongest allocation increases in consumer discretionary, consumer staples and bonds. Healthcare also gains. Technology, the US dollar and cash, by contrast, show substantially lower positioning balances.
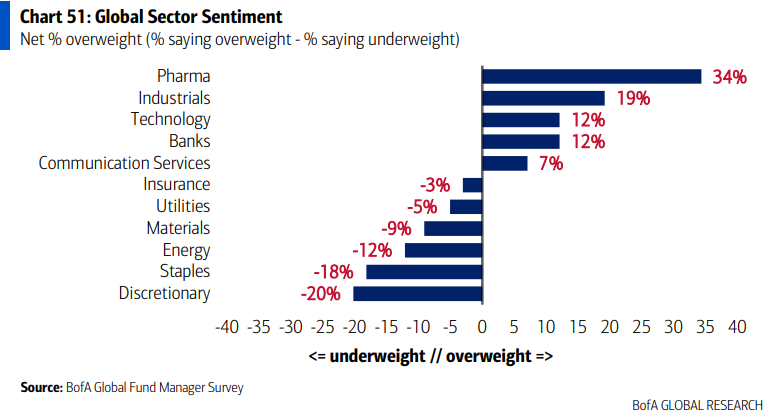
Despite the adjustment, large differences remain between segments. Pharma leads the sector comparison at a net 34% overweight, followed by industrials at 19%. Technology and banks each stand at 12%, and communication services at 7%.
At the other end, consumer discretionary remains a net 20% underweight and consumer staples a net 18% underweight. Energy stands at a net 12% underweight.
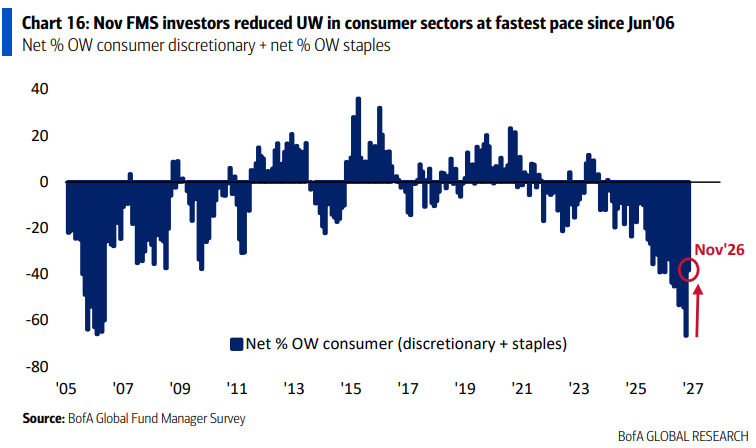
According to BofA, the combined consumer positioning balances record their largest monthly increase since June 2006. This describes a substantial reduction in underweights. The chart alone does not allow actual short covering to be quantified.
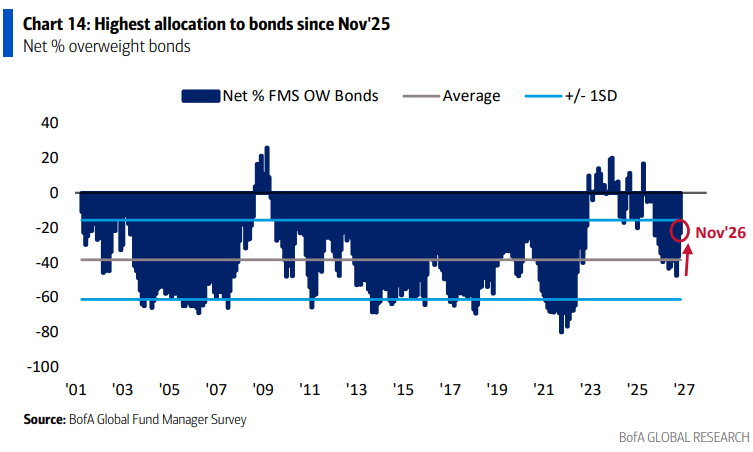
For bonds, the balance improves by 13 percentage points to a net 23% underweight, according to the chart commentary. This is the smallest underweight since November 2025; the group remains far from an overweight.
The broader overview confirms that global equities, healthcare and emerging markets remain among the favored exposures. Bonds, REITs and UK equities remain relatively unpopular.
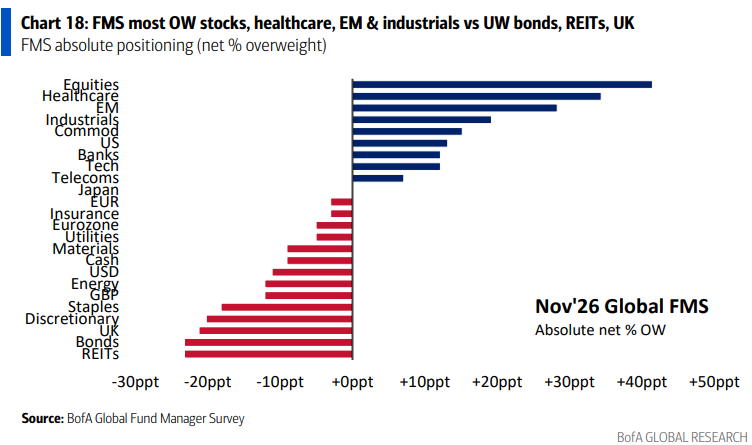
The sector groupings used are global and do not consistently match the eleven GICS sectors. Pharma and banks, for example, are narrower categories. Direct conclusions about positioning in individual S&P 500 sector ETFs would therefore go too far.
Low Cash, but a Stronger Preference for Quality
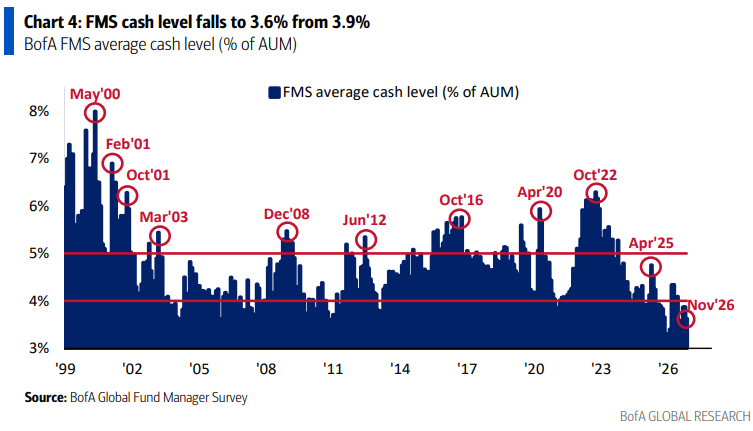
Average cash holdings fall from 3.9% to 3.6% of assets under management, a decline of 0.3 percentage points to the lowest level since August 2026. Unlike positioning balances, this metric represents an actual portfolio allocation.
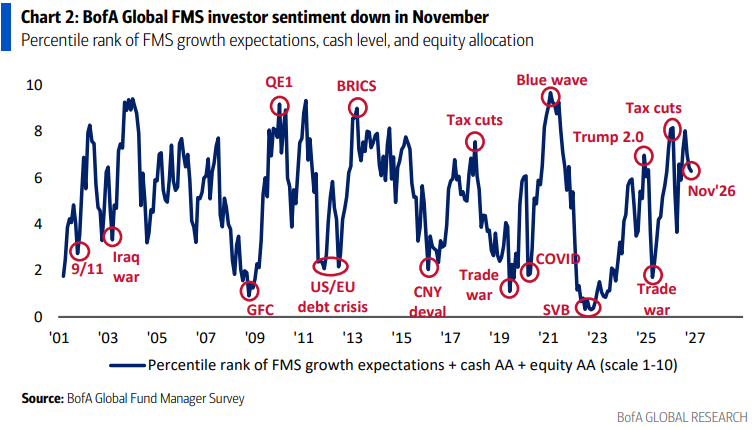
The FMS sentiment indicator simultaneously slips from 6.4 to 6.3, its lowest level since June 2026 according to BofA. The separately reported Bull & Bear Indicator stands at 7.4. These readings belong to different indicators and should not be mixed.
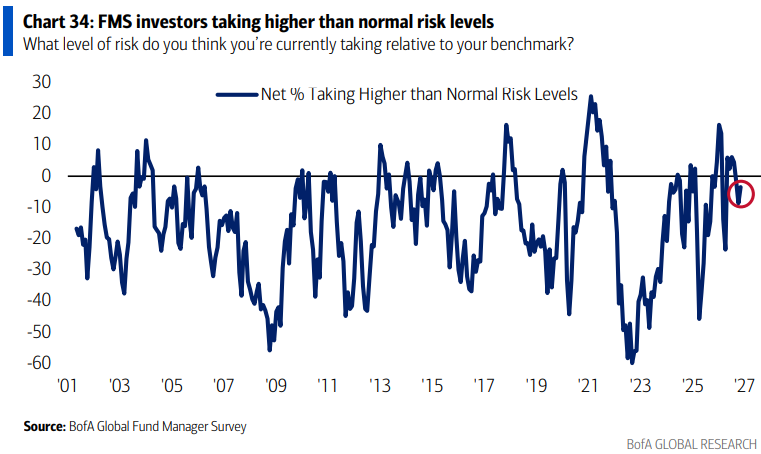
Investors’ self-assessed risk levels also do not fit an unqualified risk-on picture: The commentary accompanying Chart 34 describes a net balance of 4% in favor of lower-than-normal risk levels. The headline contradicts that statement; our interpretation follows the commentary.
The shift is particularly clear in expectations for relative winners over the next twelve months:
| Expected outperformance | Net balance |
|---|---|
| High- versus low-quality earnings | +71% |
| Large caps versus small caps | +38% |
| High versus low dividend yield | +36% |
| Low versus high volatility | +35% |
| Value versus growth | +35% |
| High-grade versus high-yield bonds | +34% |
| High versus low momentum | −16% |
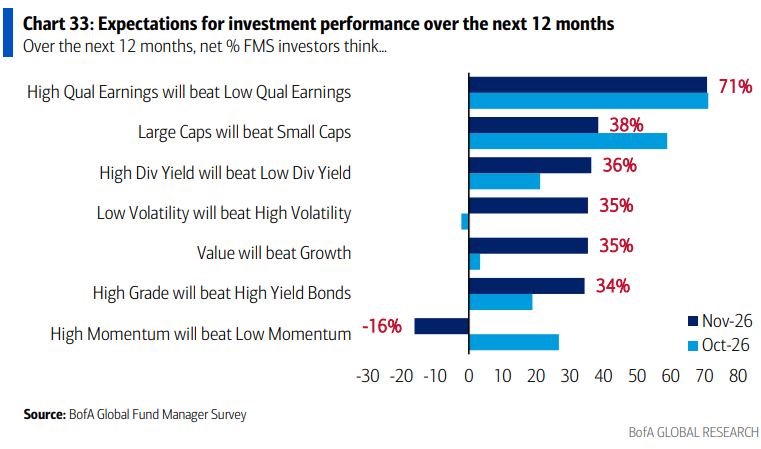
Investors remain invested but increasingly seek earnings quality, stability and more resilient earnings profiles. These survey preferences do not guarantee subsequent relative performance.
Our Assessment
November’s survey shows a substantial adjustment in the AI consensus within an overall positioning picture that remains favorable to equities. Low cash holdings and rare hard-landing expectations coexist with skepticism about tech overweights and the scale of AI investment.
For the S&P 500, the composition of the next market move is therefore particularly relevant. Broader participation from consumer sectors, healthcare and other previously weaker areas could help stabilize the index. If, however, AI investment were cut because of weaker demand while earnings expectations outside technology also deteriorated, the rotation would be less resilient.
We are watching actual capex guidance, free cash flow and financing costs at companies investing in AI, alongside earnings revisions and market breadth in other sectors. The key question is whether the earnings base broadens as the previous market favorite loses support.
The tech reduction does not automatically create a buy signal: The sector remains overweight. Equally, a 3.6% cash allocation does not establish that a market decline is imminent.
Sources and Methodology
Primary material: the supplied November 2026 BofA Global Fund Manager Survey extracts, including the overview and Charts 1, 2, 3, 4, 5, 6, 7, 8, 9, 10, 12, 14, 16, 17, 18, 33, 34 and 51. BofA supplies the survey data; Chart 6 additionally credits Bloomberg for market data. The numbers in the image placeholders refer to the upload order across both batches.
Net positioning subtracts the share reporting an underweight from the share reporting an overweight; it is not an invested portfolio allocation. Net expectation balances must be distinguished from simple response shares. Positioning changes do not establish monetary capital flows. Historical extremes refer to the BofA series shown.
Supplementary cross-check: Reuters, November 17, 2026, “Investors slashed tech exposure last month, anticipate less capital spending”: https://d2233.cms.socastsrm.com/2026/11/17/investors-slashed-tech-exposure-last-month-anticipate-less-capital-spending/
This article is for information and research purposes and does not constitute investment advice or a recommendation to buy or sell.