What History Actually Tells Us
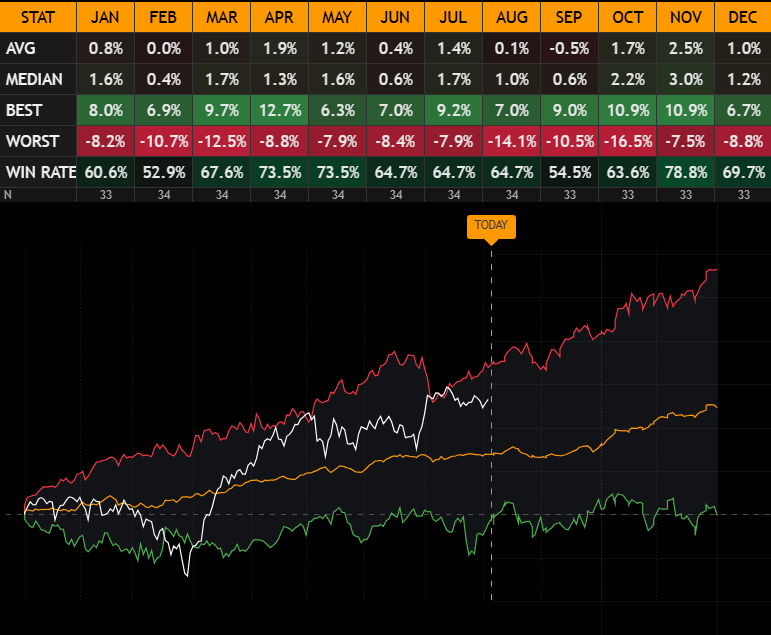
September has long carried the reputation of being the weakest month for U.S. equities. Looking at the historical seasonality of the S&P 500 and all 11 GICS sectors, that reputation is largely justified.
But the weakness is far from uniform.
Some sectors show a persistent negative September bias across average returns, median returns and win rates. In others, the average is weak even though the typical September has been positive — suggesting that large downside events, rather than consistently negative performance, are driving the seasonal effect.
To see where September weakness has historically been most pronounced, we rank all 11 GICS sectors from the weakest to strongest average September return.
Don't want to miss more data-driven market insights like this? Check out our Weekly Market Recap:
https://finq-research.kit.com/cc5c1deec7
S&P 500 (SPY): Weak Average, Positive Median
Before looking at individual sectors, the broader market provides an important benchmark.
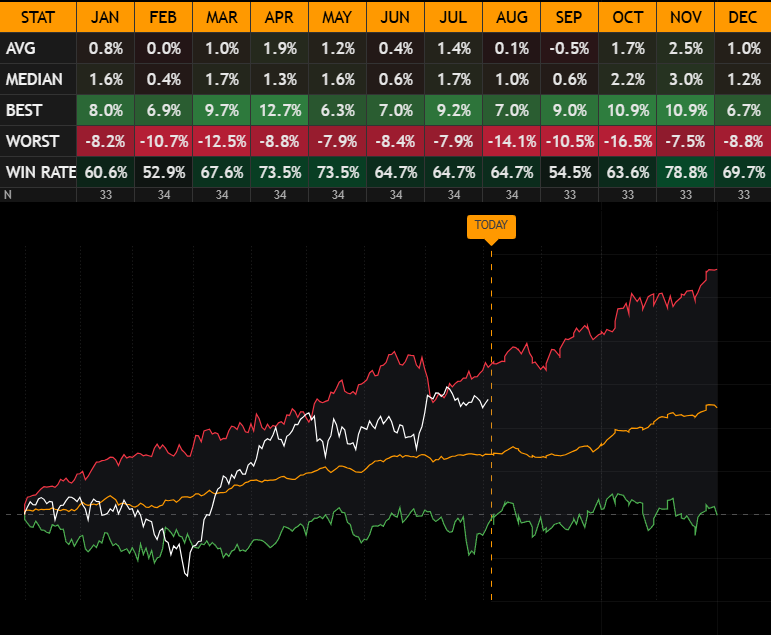
SPY has averaged -0.5% in September, making it the weakest month of the year based on average returns. However, the median September return is actually +0.6%, while 54.5% of observations have finished positive.
The range of outcomes is wide: the best September returned +9.0%, while the worst declined -10.5%.
That gap between average and median is important. September has not historically been a month in which the market simply falls more often than it rises. Instead, larger negative observations have been sufficient to pull the long-term average below zero.
The sector data shows that this effect is even more pronounced in some parts of the market.
1. Real Estate (XLRE): The Weakest September Profile
Real Estate sits at the bottom of the September ranking.
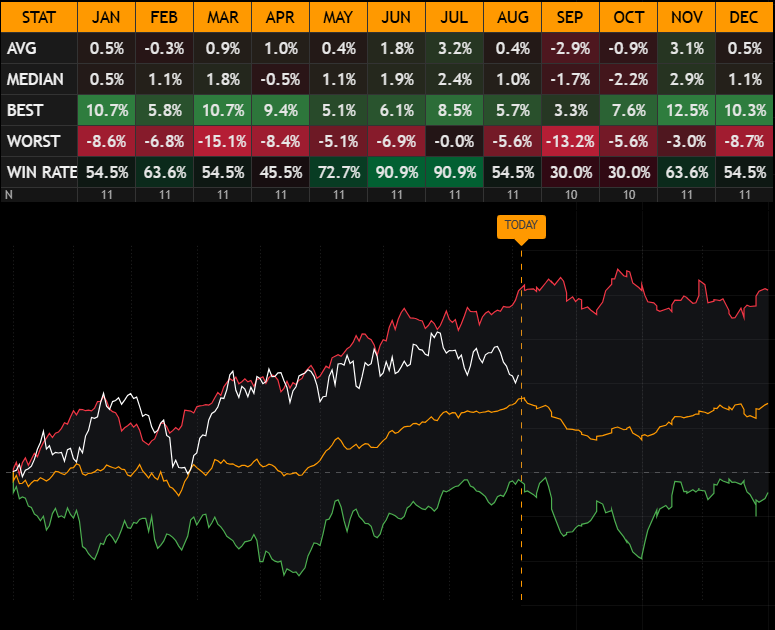
XLRE has historically returned -2.9% on average, with a -1.7% median and only a 30.0% win rate. Its worst September saw the sector decline -13.2%.
Unlike SPY, there is little disagreement between the statistics: average, median and win rate all point toward weakness. This suggests that Real Estate's poor September performance has not been driven solely by a handful of extreme observations.
The main caveat is sample size. XLRE has only 10 September observations, so its seasonal pattern should be interpreted with more caution than sectors with longer histories.
2. Materials (XLB): Broad-Based September Weakness
Materials have historically been one of the weakest areas of the market in September.
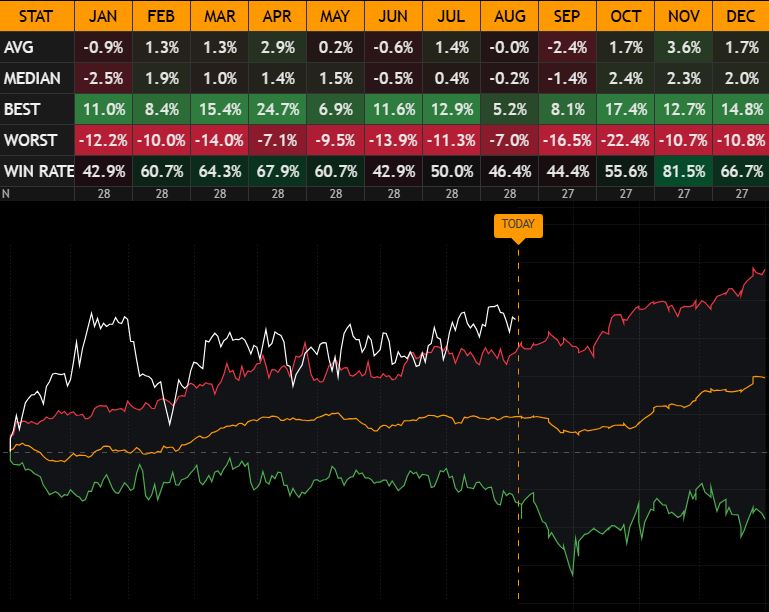
XLB has averaged -2.4%, with a median return of -1.4% and a 44.4% win rate. Its worst September produced a substantial -16.5% decline.
The negative median is particularly important. Unlike sectors where a few severe drawdowns distort the average, the typical September has also been negative for Materials.
That makes XLB one of the clearer examples of persistent September weakness in the sector universe.
3. Communication Services (XLC): Weak Across the Distribution
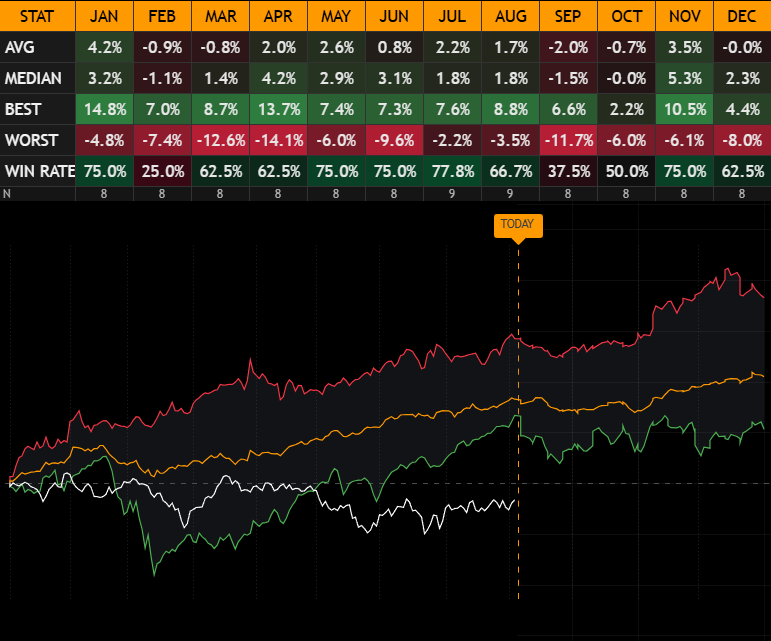
Communication Services have generated an average September return of -2.0%, accompanied by a -1.5% median and a win rate of just 37.5%.
The combination points toward relatively broad weakness rather than simply a negative average caused by a few extreme years.
However, XLC has the shortest history in our analysis, with only eight September observations. The seasonal profile is clearly weak in the available data, but the smaller sample means it should carry less statistical weight than longer-established sector ETFs.
4. Technology (XLK): Downside Events Drive the Average
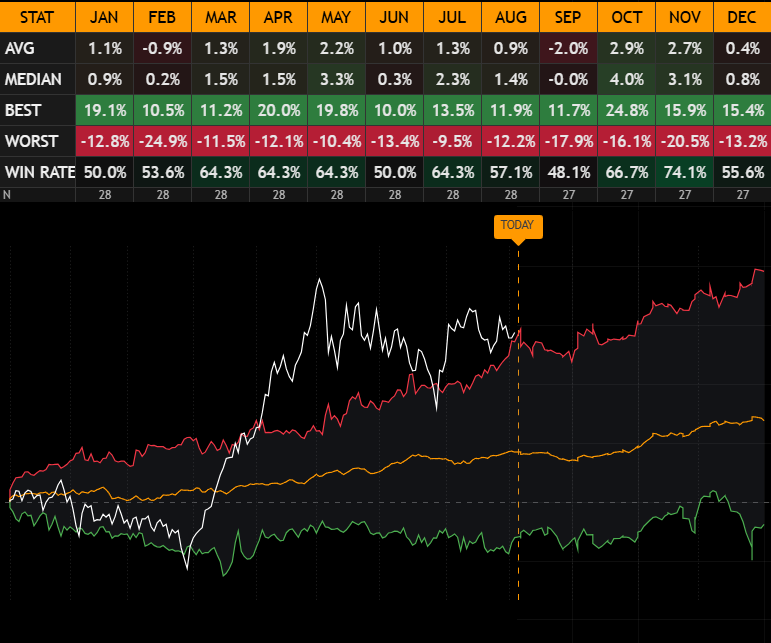
But underneath the average, the picture is more balanced. XLK's median September return is approximately 0%, while its win rate stands at 48.1%.
The worst September in the sample produced a -17.9% decline, one of the largest downside observations across the sectors.
The gap between the -2.0% average and roughly flat median suggests that large negative Septembers have had a disproportionate impact on Technology's historical average.
5. Financials (XLF): Consistent Negative Bias
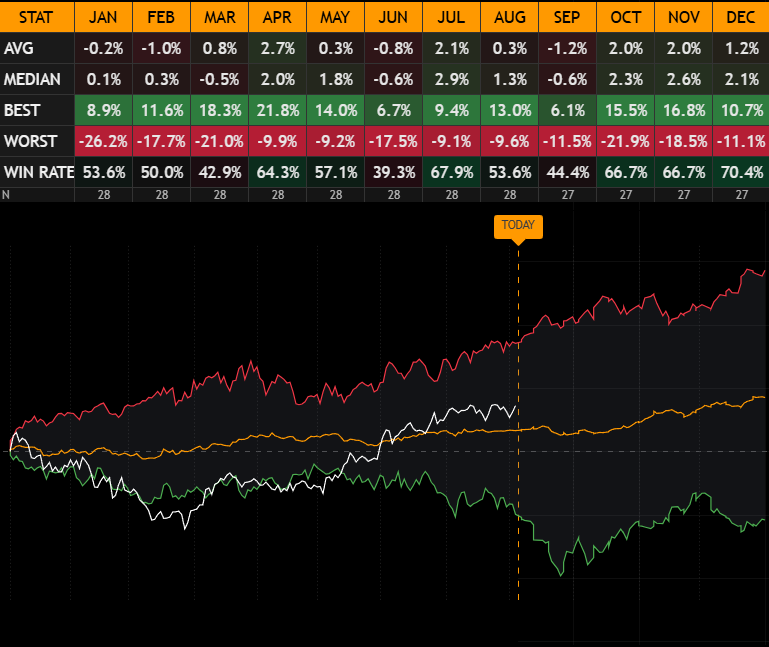
Financials rank in the middle of the weaker September sectors.
XLF has historically averaged -1.2%, with a median return of -0.6% and a 44.4% win rate. The worst September saw Financials decline -11.5%.
Unlike Technology, there is no major divergence between average and median. Both are negative, suggesting that the weakness has historically been more broadly distributed across September observations.
6. Health Care (XLV): Defensive, but Not in September
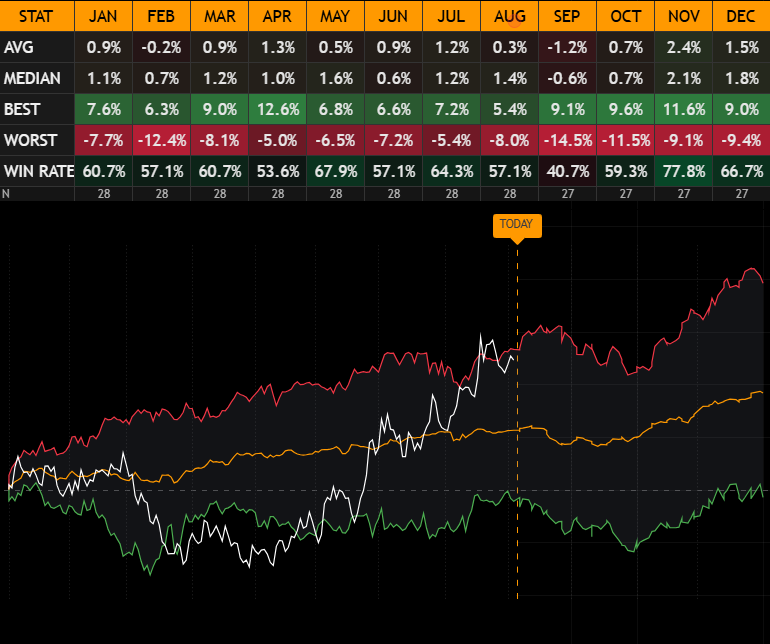
Health Care shares the same -1.2% average September return, but its win rate is even weaker at 40.7%, alongside a median return of -0.6%.
The worst September in the sample resulted in a -14.5% decline.
This is notable given Health Care's traditional defensive characteristics. Historically, those characteristics have not translated into strong September seasonality. Both the frequency and magnitude of negative returns point toward a clear seasonal headwind.
7. Industrials (XLI): The Median Tells a Different Story
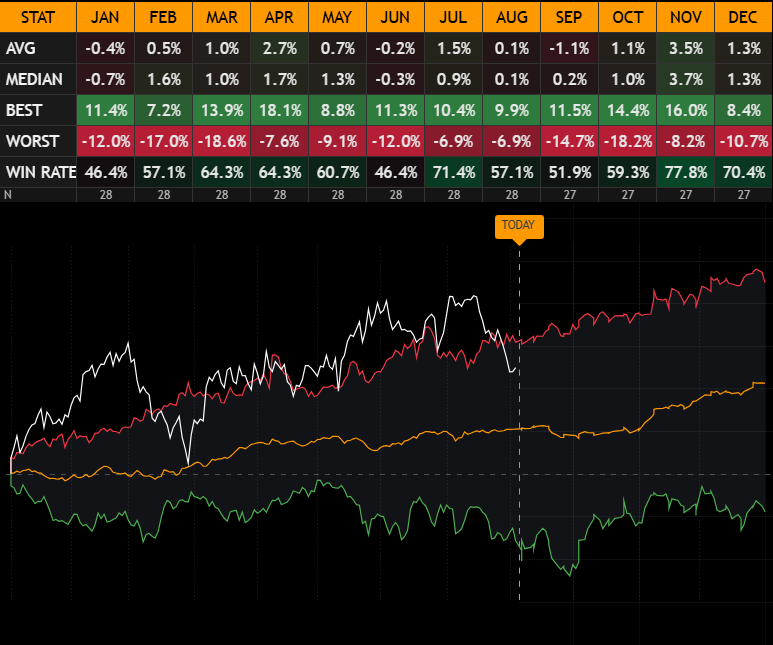
Industrials have averaged -1.1% in September, but the underlying distribution looks considerably better.
The median return is +0.2%, while 51.9% of Septembers have finished positive. At the same time, the worst September produced a -14.7% decline.
This is similar to the pattern seen in SPY. The typical September has not necessarily been negative for Industrials. Instead, large downside observations have pulled the average return below zero.
8. Energy (XLE): A Negative Average, but Strong Median
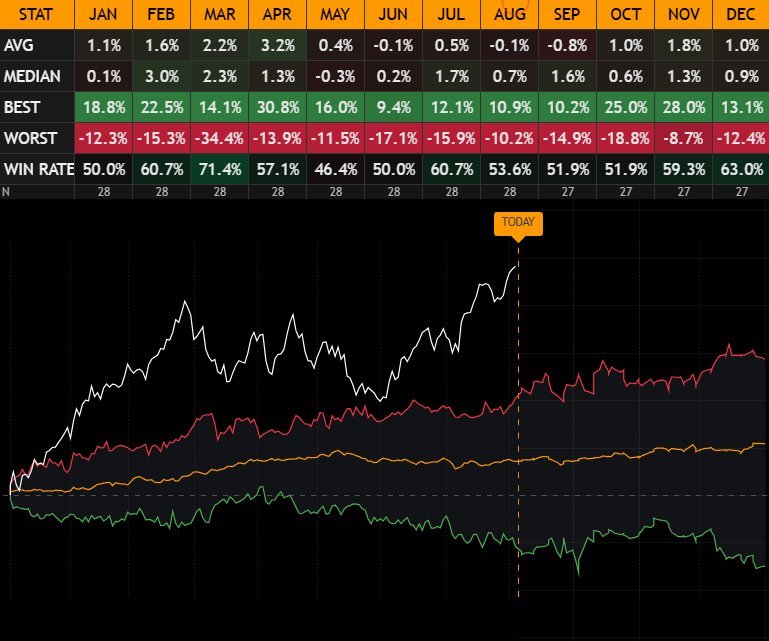
Energy provides perhaps the clearest example of why average returns should not be viewed in isolation.
XLE has averaged -0.8% in September, yet its median September return is a surprisingly strong +1.6%, with a 51.9% win rate.
That is a significant divergence.
The worst September saw Energy decline -14.9%, helping explain why the long-term average remains negative despite a positive median.
Historically, the typical September for Energy has therefore been considerably stronger than the average suggests, with downside tail events responsible for much of the apparent seasonal weakness.
9. Consumer Discretionary (XLY): Moderate but Consistent Weakness
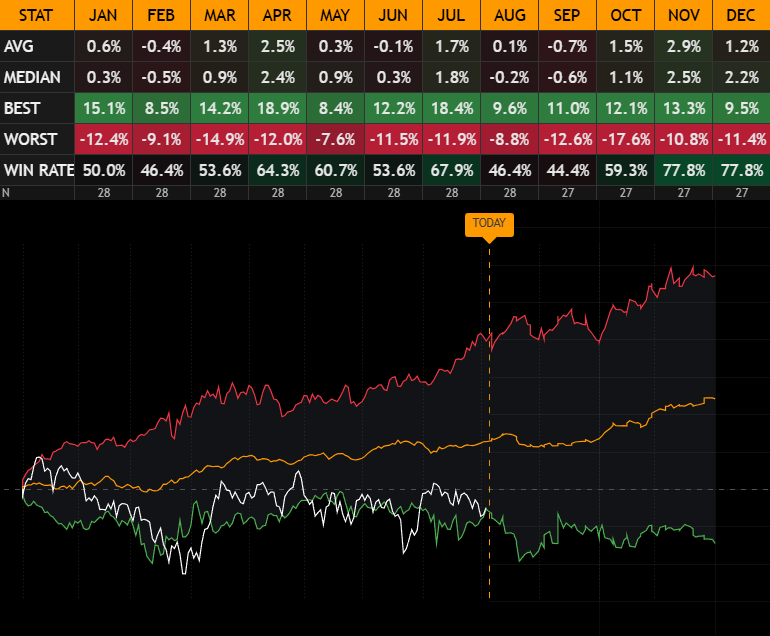
Consumer Discretionary has historically averaged -0.7% in September, with a median return of -0.6% and a 44.4% win rate.
Its worst September produced a -12.6% decline.
Unlike Energy or Industrials, average and median are closely aligned. That suggests September weakness has been relatively consistent rather than being primarily the result of a small number of extreme negative observations.
The seasonal headwind is therefore less severe than in Technology or Materials, but still visible across the distribution.
10. Consumer Staples (XLP): Relatively Resilient
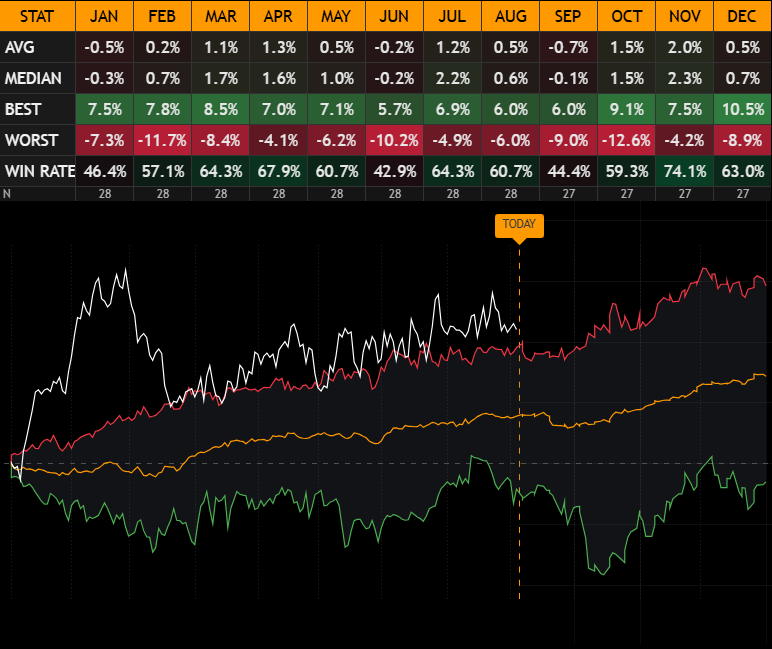
Consumer Staples also average -0.7% in September, but the underlying profile is slightly stronger.
The median September return is nearly flat at -0.1%, while the historical win rate stands at 44.4%. The worst September produced a -9.0% decline.
Compared with many cyclical sectors, the magnitude of the weakness is relatively contained. Staples have not escaped the September effect entirely, but historically they have shown greater downside resilience than many other parts of the market.
11. Utilities (XLU): The Clear September Outlier
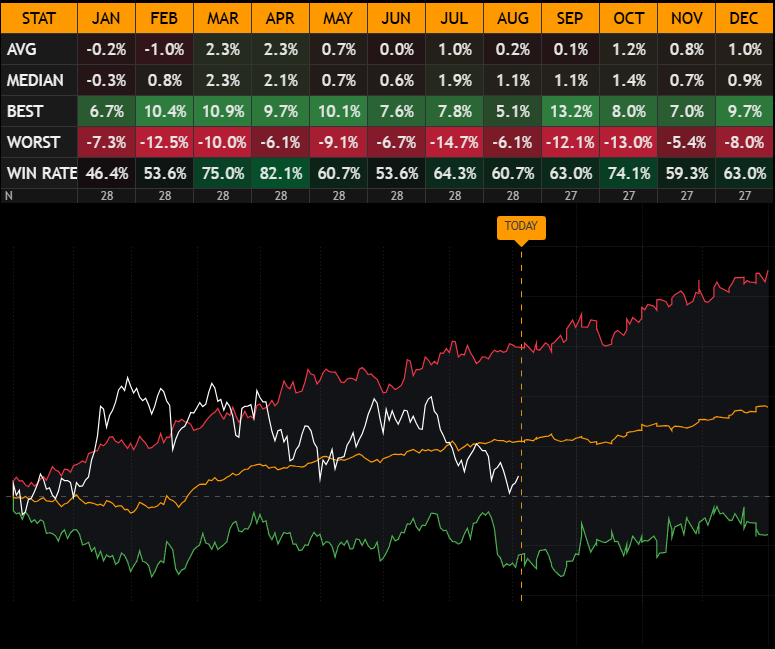
Utilities sit at the opposite end of the ranking.
XLU is the only GICS sector with a positive average September return, at +0.1%. More importantly, the median return is +1.1%, while 63.0% of September observations have finished positive.
That is the highest September win rate across all sectors in our analysis.
The positive average may appear modest, but the combination of average, median and win rate makes Utilities the clear exception. Historically, September has been considerably more favorable for Utilities than for the broader equity market.
What the September Effect Really Tells Us
Ranking the sectors reveals just how uneven September seasonality has historically been.
At one extreme, Real Estate and Materials show negative averages, negative medians and low win rates. At the other, Utilities are the only sector with a positive average and have finished September higher in 63% of observations.
Between those extremes, another pattern emerges.
SPY averages -0.5% despite a +0.6% median. Energy averages -0.8% despite a +1.6% median. Industrials average -1.1% despite a +0.2% median.
That suggests the September effect is not simply about a higher probability of stocks falling.
It is also about downside asymmetry.
Historically, several parts of the market have risen as often — or even more often — than they have fallen during September. But when negative Septembers occurred, some of those declines were large enough to materially drag down the long-term average.
There is also an important seasonal transition immediately afterward. For SPY, the average return improves from -0.5% in September to +1.7% in October and +2.5% in November, with November positive in 78.8% of observations.
September should therefore not be interpreted as a standalone bearish trading signal. Instead, the historical data suggests a more nuanced framework:
September has historically been characterized by weaker average returns, substantial sector dispersion and elevated downside asymmetry — immediately before the seasonal backdrop improves into Q4.
Seasonality does not tell us what will happen this September. But it does tell us where historical risk has been concentrated — and where the headline "September is the worst month" misses the more interesting story.
Disclaimer
This content is provided for informational and research purposes only and does not constitute investment advice, financial advice, or a recommendation to buy or sell any security.
While every effort has been made to ensure the accuracy of the data presented, no guarantee is made regarding its accuracy, completeness, or reliability. Historical performance and seasonality are not indicative of future results.